
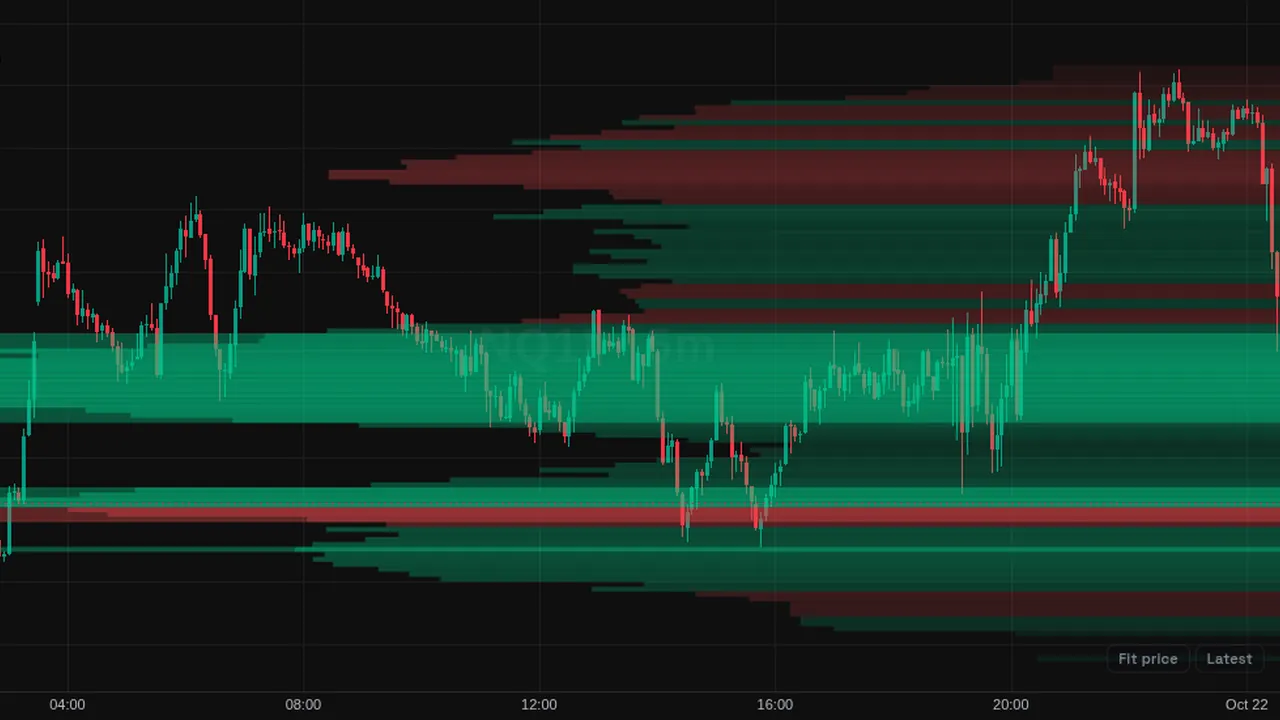
Shades horizontal bands behind price where the most volume traded in the visible range, coloured by candle direction.
In plain English
What it shows
- Horizontal bands behind the candles at the prices where the most volume built up in the visible range. Green means up candles contributed more, red means down candles did.
How traders use it
- Spot prices where a lot of trading happened.
- Zoom to a different range to see how the bands change.
What it does not tell you
- It is built from candle volume and range, not trades at each price.
- It does not show resting orders; use the depth heatmaps for that.
Overview
Volume Heatmap paints horizontal rows behind the candles at the prices where volume built up. Busier rows are wider and more opaque. By default each row is green when up candles contributed more of its volume and red when down candles did; a single-colour mode is also available.
How it works
For the visible bars, each bar's volume is spread evenly across the price rows between its low and high, and added with the sign of the candle (up or down). Rows on futures are 4 ticks by default, and are doubled in size when they would be too thin on screen. On other markets the row size follows the visible price range.
Only rows above 8% of the busiest row are drawn, with opacity up to 42%.
How to use it
- Some traders use it to see high-volume price areas at a glance.
- Use the colour to see whether up or down candles built each area.
- Some traders watch how price behaves when it returns to a heavy band.
These are ways some traders read it, for learning. They are not trade signals.
Settings
| Setting | Default |
|---|---|
| Average lookback | 50 |
| Show rows above (% of max) | 8 |
| Row size (ticks, futures) | 4 |
| Max opacity % | 42 |
| Colour modeOptions: candle direction, single colour | candle direction |
| Up heat colour | #03c988 |
| Down heat colour | #e5484d |
| Single heat colour | #38bdf8 |
Notes and limits
- Built from candle volume and range, not from trades at each price.
- The heatmap follows the visible range, so it changes as you scroll or zoom.
- It does not show resting orders; for the order book, see the order-flow heatmaps.
Education only. Not financial advice. Indicators mark what happened on the chart; they do not predict what price will do. Trading futures, forex, crypto and other markets carries a high level of risk and may not be suitable for everyone.