
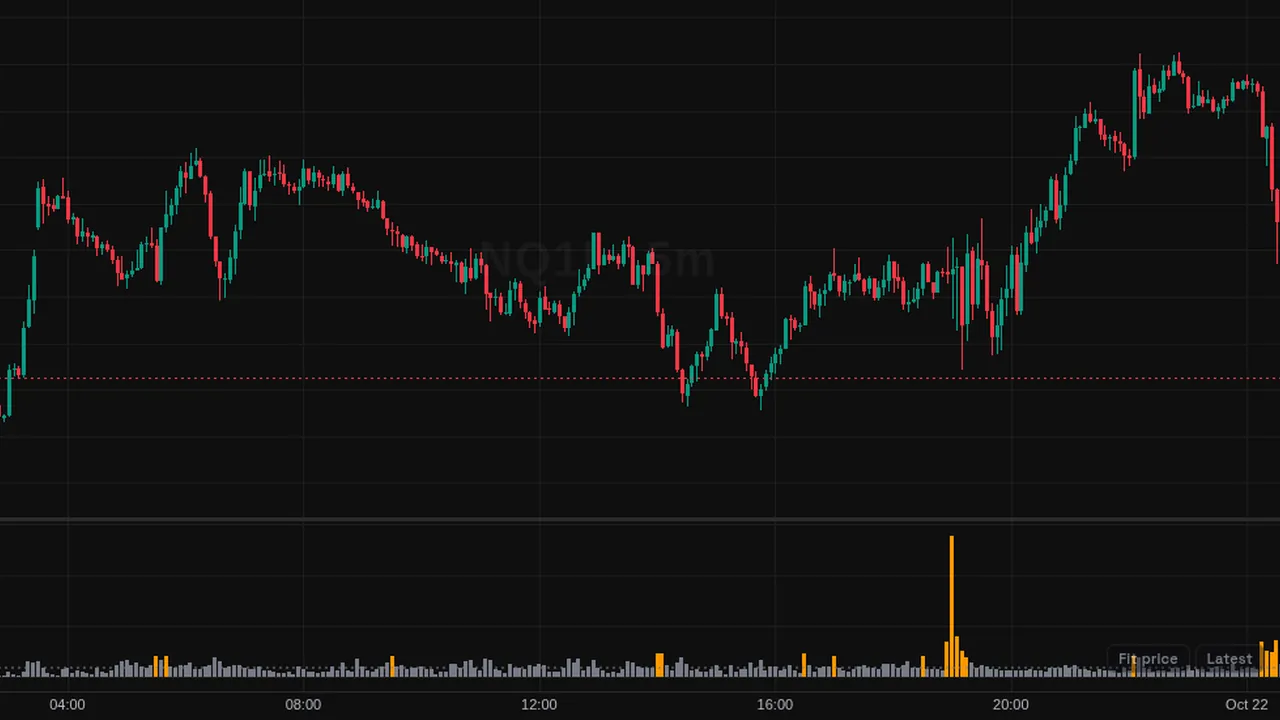
Shows each bar's volume as a multiple of the average volume at the same time of day, as a histogram with high bars highlighted.
Overview
Relative Volume (RVOL) draws a histogram in a lower pane. Each bar's value is its volume divided by a normal volume for that bar. A value of 1 means average, marked by a dotted line; bars at or above 2 times average are highlighted in orange by default.
How it works
On intraday charts the average is the volume at the same time of day over the previous 10 days. If there is not enough same-time history, for example on a short chart, it falls back to a rolling average of the previous 10 bars.
On daily and higher charts it uses a simple average of the previous 10 bars. You can change the lookback and the highlight level.
How to use it
- Some traders watch for bars that trade far more volume than usual for that time of day.
- Use it to compare the open or a news bar with typical activity.
- Some traders check whether a breakout came with above-average volume.
These are ways some traders read it, for learning. They are not trade signals.
Settings
| Setting | Default |
|---|---|
| Lookback (sessions / bars)Intraday: the average volume of the same time of day over this many earlier days. Daily and above: a simple average of this many bars. | 10 |
| Highlight at or above (x) | 2 |
| Colour | #787b86 |
| Highlight colour | #ff9800 |
Notes and limits
- Needs bars with volume.
- Same-time averages need several days of intraday history to be meaningful.
Education only. Not financial advice. Indicators mark what happened on the chart; they do not predict what price will do. Trading futures, forex, crypto and other markets carries a high level of risk and may not be suitable for everyone.