
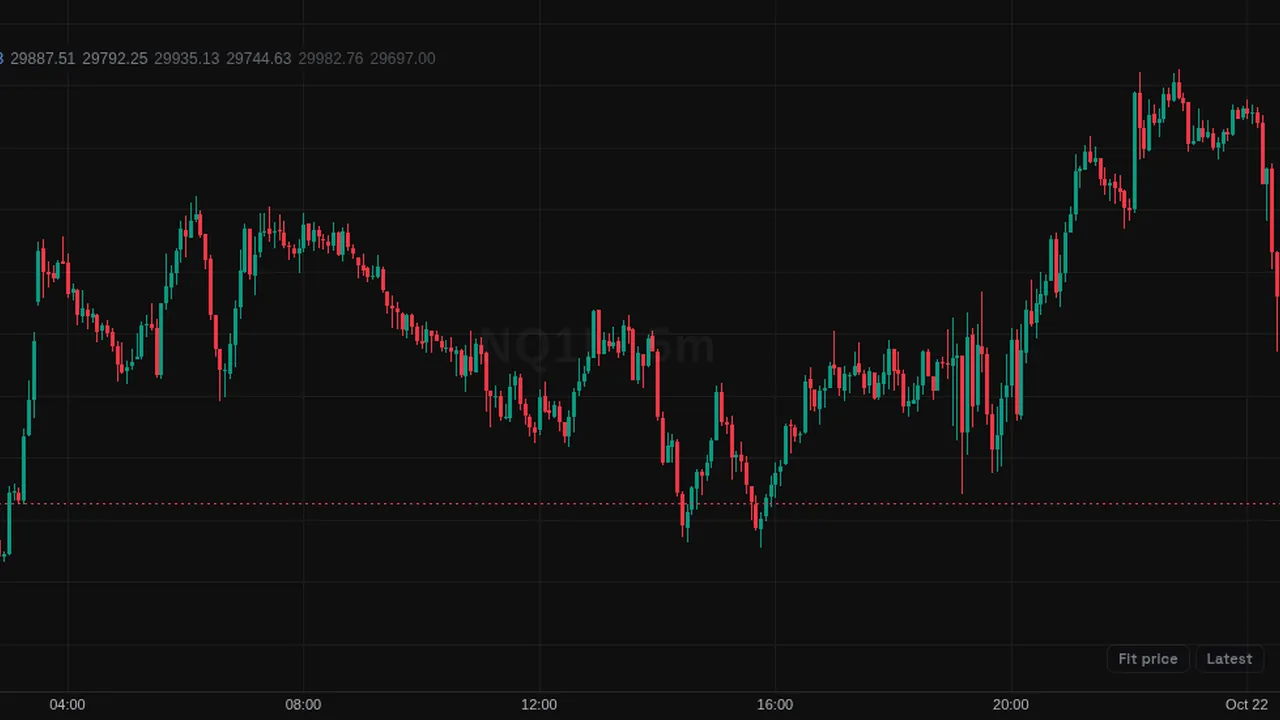
Plots a volume-weighted average price from a chosen bar, with bands one, two and three standard deviations above and below.
In plain English
What it shows
- The volume-weighted average price (VWAP) from a bar you choose, with bands one, two and three standard deviations above and below. VWAP is the average price paid, weighted by volume.
How traders use it
- Anchor it to a swing, an event or a session start and see where price sits against the average.
- Add more than one copy with different anchors.
What it does not tell you
- It uses candle prices, not every trade.
- The anchor stays where you put it until you change it.
Overview
Anchored VWAP draws the volume-weighted average price starting from an anchor bar, with up to three bands above and below it. The area between the first bands is lightly shaded. By default the anchor is the start of the latest session, and you can add more than one copy with different anchors.
How it works
From the anchor onward, each bar's typical price (high plus low plus close, divided by three) is weighted by its volume. The VWAP is the running sum of price times volume divided by the running sum of volume. The bands are the volume-weighted standard deviation of typical price around the VWAP, at 1, 2 and 3 deviations.
If the chart has no volume, every bar counts equally. You can set the anchor time in the settings, or use the 'click a bar to anchor' row in the picker.
How to use it
- Some traders anchor to a major high, low or news bar to see the average price since then.
- Use the bands to see how far price has stretched from its average.
- Some traders watch how price reacts when it returns to the VWAP line.
- Use several copies to compare averages from different starting points.
These are ways some traders read it, for learning. They are not trade signals.
Settings
| Setting | Default |
|---|---|
| Anchor (bar time)Empty = the start of the latest session. Use the picker row "click a bar" to set it on the chart. | 0 |
| Band ±1 sd | On |
| Band ±2 sd | On |
| Band ±3 sd | On |
| VWAP colour | #5b9cf6 |
| Band colour | #9aa0ad |
Notes and limits
- Built from candles, so it uses the typical price of each bar rather than every trade.
- The anchor stays fixed until you change it.
Education only. Not financial advice. Indicators mark what happened on the chart; they do not predict what price will do. Trading futures, forex, crypto and other markets carries a high level of risk and may not be suitable for everyone.