
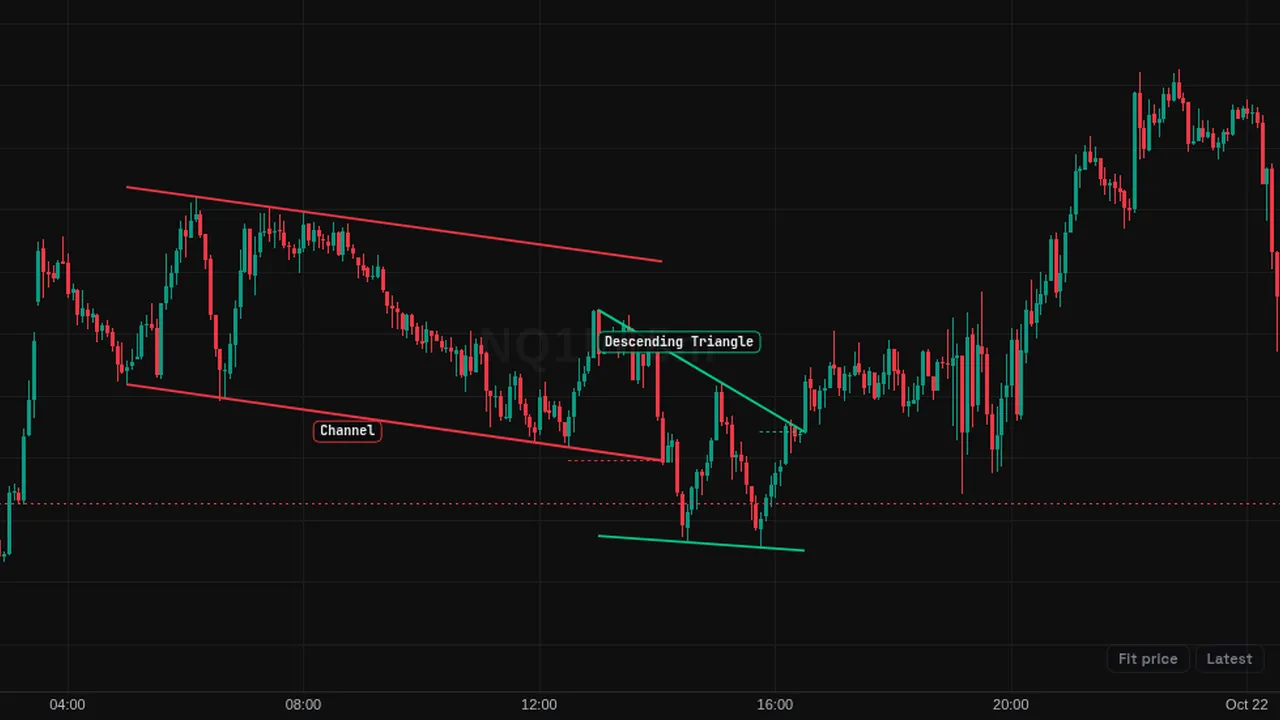
Finds classic chart patterns from swing pivots and draws them with outline lines, names and a neckline or breakout line.
Overview
Auto Chart Patterns looks for classic shapes in price and draws them on the chart. It covers double tops and bottoms, head and shoulders and inverse head and shoulders, ascending, descending and symmetrical triangles, rising and falling wedges, bull and bear flags, and channels.
Each pattern gets outline lines, a small name label and a dotted neckline or breakout line. An optional dotted line shows the measured-move target. By default the newest 6 patterns are shown.
How it works
The indicator builds a zigzag of swing pivots, with a pivot length of 5 bars each side by default; a larger length finds fewer, larger patterns. Recent pivots are matched against each pattern's shape.
A pattern is shown as forming until a bar closes through its neckline or trendline; then it is complete. Only new closed bars are read, and only the last set of pivots is kept. Each pattern type can be switched on or off.
How to use it
- Some traders use it to spot classic shapes they might miss by eye.
- Use the forming patterns to see which neckline or trendline price is testing.
- Some traders compare the measured-move line with nearby levels.
- Use it to practise recognising patterns on past charts.
These are ways some traders read it, for learning. They are not trade signals.
Settings
| Setting | Default |
|---|---|
| Pivot length (bars each side)Bigger = fewer, larger patterns. Smaller = more, smaller ones. | 5 |
| Show forming patterns | On |
| Show measured-move target line | Off |
| Show pattern names | On |
| Show at most (newest) | 6 |
| Rising-side colour | #03c988 |
| Falling-side colour | #f23645 |
| Neutral colour | #f5b301 |
| Double Top | On |
| Double Bottom | On |
| Head & Shoulders | On |
| Inverse Head & Shoulders | On |
Show all 20 settings
| Setting | Default |
|---|---|
| Ascending Triangle | On |
| Descending Triangle | On |
| Symmetrical Triangle | On |
| Rising Wedge | On |
| Falling Wedge | On |
| Bull Flag | On |
| Bear Flag | On |
| Channel | On |
Notes and limits
- Patterns depend on the pivot length; different settings find different patterns.
- It draws patterns, not signals; many patterns do not play out.
Education only. Not financial advice. Indicators mark what happened on the chart; they do not predict what price will do. Trading futures, forex, crypto and other markets carries a high level of risk and may not be suitable for everyone.