
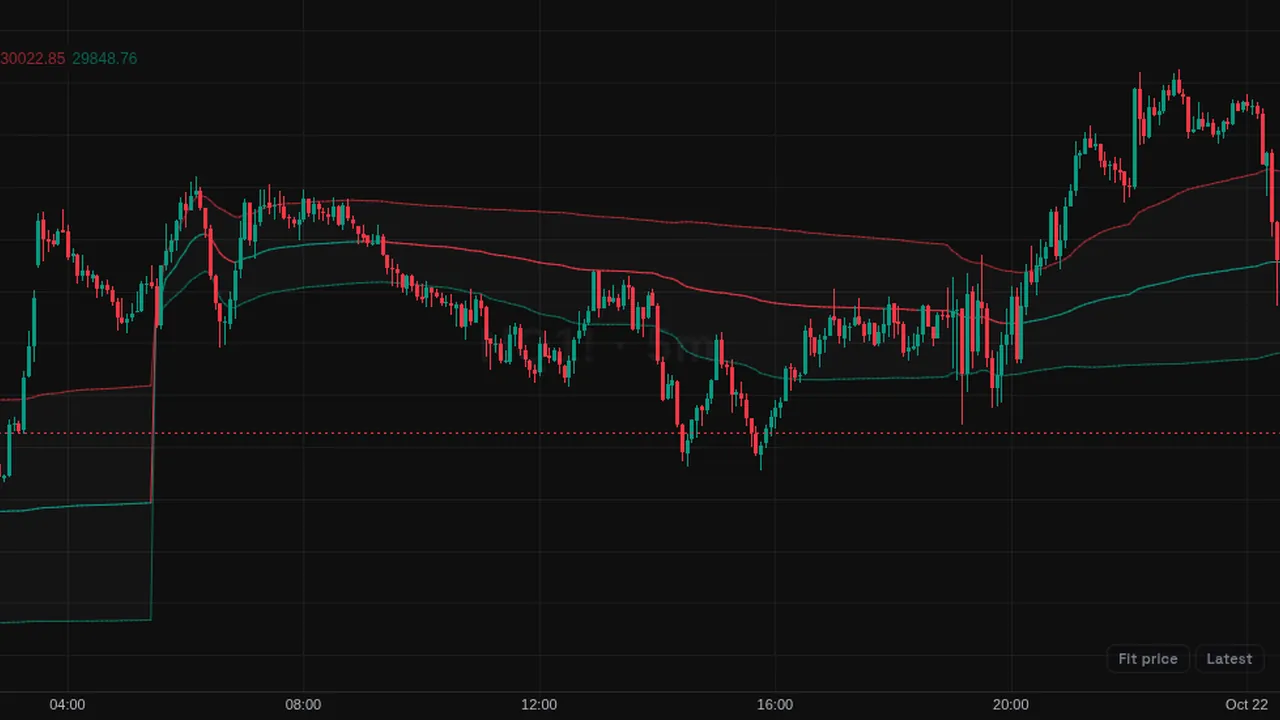
VWAP: the volume weighted average of typical price, reset each session, with optional deviation bands.
In plain English
What it shows
- VWAP is the average price traded so far, weighted by volume, with optional bands based on standard deviation (a measure of spread).
How traders use it
- Some traders watch whether price is above or below VWAP during the session.
- Bands show how stretched price is from the average.
What it does not tell you
- It resets on the anchor you choose, so the starting point matters.
- It uses candle prices and volume.
Overview
The Volume Weighted Average Price (VWAP) draws one line on the price chart that shows the average price paid, weighted by volume, since the start of the period. It resets each session by default.
The line is green while price closes above it and red while below. Optional bands sit at one, two or three standard deviations, or at percent distances.
How it works
VWAP = sum of (typical price x volume) / sum of volume, from the start of the anchor period. Typical price = (high + low + close) / 3.
The anchor can be session, week, month, quarter or year (UTC). Bands use the volume-weighted standard deviation of price around VWAP, or a percentage of VWAP. By default only band 1 is shown, and VWAP is hidden on daily and higher charts.
How to use it
- Some traders watch whether price holds above or below VWAP during the day.
- Use the bands to see price stretched from the day's average.
- Watch returns to VWAP after a move as a reference level.
- Use a weekly or monthly anchor for a longer view.
These are ways some traders read it, for learning. They are not trade signals.
Settings
| Setting | Default |
|---|---|
| Settings | |
| Anchor PeriodPeriod anchoring the average. VWAP and its bands reset on the first bar of each new session, week, month, quarter or year (UTC).Options: Session, Week, Month, Quarter, Year | Session |
| SourcePrice used in the volume weighted average. Typical price (HLC3) is the classic choice.Options: Close, Open, High, Low, HL2, HLC3, OHLC4, HLCC4 | HLC3 |
| Bands ModeBands offset method: multiples of the volume weighted standard deviation of price around VWAP, or a percentage of the VWAP value.Options: Standard Deviation, Percentage | Standard Deviation |
| Band #1Show the first band pair. | On |
| Band #1 MultiplierMultiplier for this band pair, in standard deviations or percent depending on the bands mode. | 1 |
| Band #2Show the second band pair. | Off |
| Band #2 MultiplierMultiplier for this band pair, in standard deviations or percent depending on the bands mode. | 2 |
| Band #3Show the third band pair. | Off |
| Band #3 MultiplierMultiplier for this band pair, in standard deviations or percent depending on the bands mode. | 3 |
| Hide VWAP on 1D or AboveHide the VWAP and its bands on daily and higher timeframes, where an intraday anchored VWAP is not meaningful. | On |
| Style | |
| BullishVWAP line color while price closes above it, and the color of the lower (support) bands. | #089981 |
| BearishVWAP line color while price closes below it, and the color of the upper (resistance) bands. | #f23645 |
| BandsDeviation bands fill color. | #787b86 |
| Bands FillFill the area between each visible band pair. | On |
Alerts
You can alert on its line crossing a value or the candle close (from the chart's + menu); checked while ZoroCharts is open.
Notes and limits
- It needs volume data; on symbols without volume it shows nothing useful.
- Periods reset in UTC.
Education only. Not financial advice. Indicators mark what happened on the chart; they do not predict what price will do. Trading futures, forex, crypto and other markets carries a high level of risk and may not be suitable for everyone.