
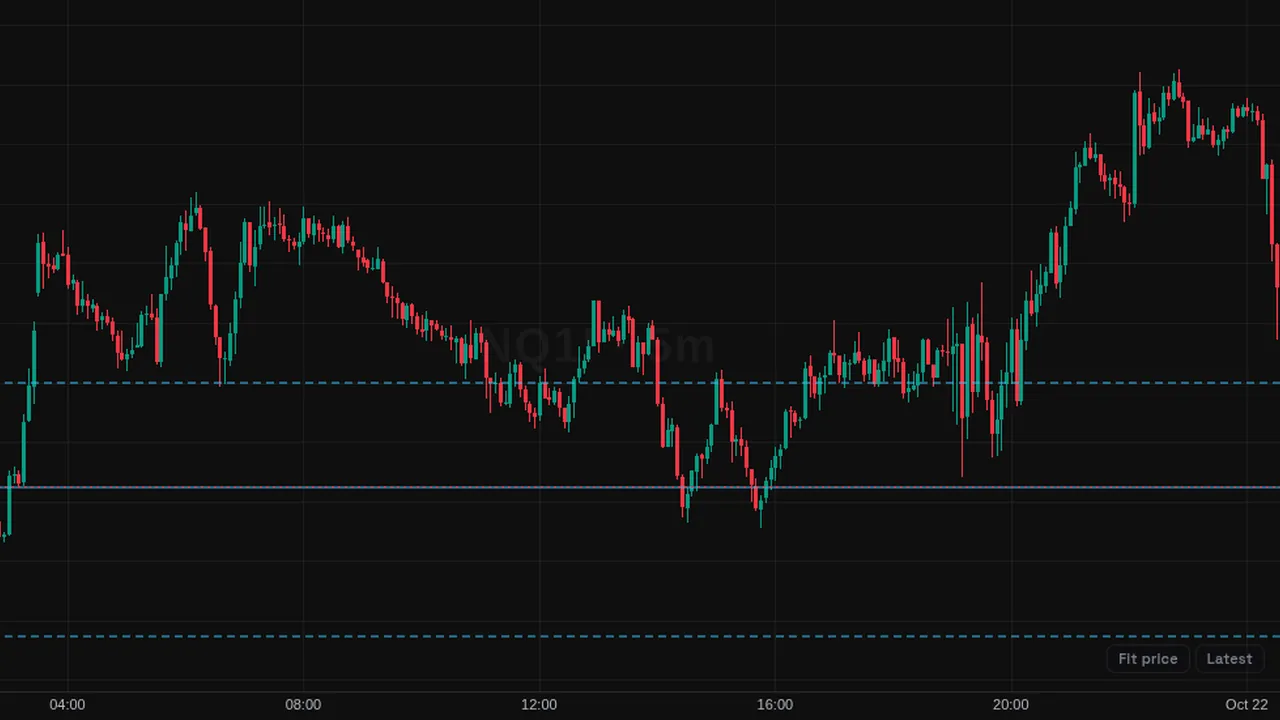
Draws the prior session's point of control as a solid line and its value area high and low as dashed lines on today's chart.
In plain English
What it shows
- Three lines from the last full session: the point of control (POC, the busiest price) as a solid line, and the value area high and low (VAH and VAL, the range holding about 70% of volume) as dashed lines.
How traders use it
- Some traders use them as reference prices for today.
- Compare where today opens with the previous day's value area.
What it does not tell you
- They are built from candle volume, not individual trades.
- They describe yesterday. Price can ignore them.
Overview
Previous Day POC / VAH / VAL draws three price lines from the last full session: the point of control (pPOC) as a solid line, and the value area high and low (pVAH and pVAL) as dashed lines. They use the same definition as the pPOC, pVAH and pVAL on the GEX page.
How it works
On futures, the indicator takes the prior RTH session (09:30 to 16:00 New York) and builds a volume profile from 5-minute bars, rolling 1-minute bars up to 5 minutes first. Rows are 4 ticks by default. The value area starts at the POC and grows toward the larger neighbour until it holds 70% of the volume.
On crypto, the previous UTC day is used and the row size is chosen from that day's range. The levels are computed from this chart's own bars.
How to use it
- Some traders watch how price behaves when it returns to yesterday's POC.
- Use pVAH and pVAL to see whether today is trading inside or outside the prior value area.
- Some traders mark these levels before the open as reference points.
These are ways some traders read it, for learning. They are not trade signals.
Settings
| Setting | Default |
|---|---|
| Row size (ticks, futures)The GEX page uses 4 ticks. | 4 |
| Value area % | 70 |
| Colour | #38bdf8 |
| pPOC | On |
| pVAH / pVAL | On |
Notes and limits
- Needs an intraday chart from 1 minute to 1 hour.
- It needs enough history for the previous session; otherwise it shows a short note.
- The levels come from candle volume, not individual trades.
Education only. Not financial advice. Indicators mark what happened on the chart; they do not predict what price will do. Trading futures, forex, crypto and other markets carries a high level of risk and may not be suitable for everyone.