
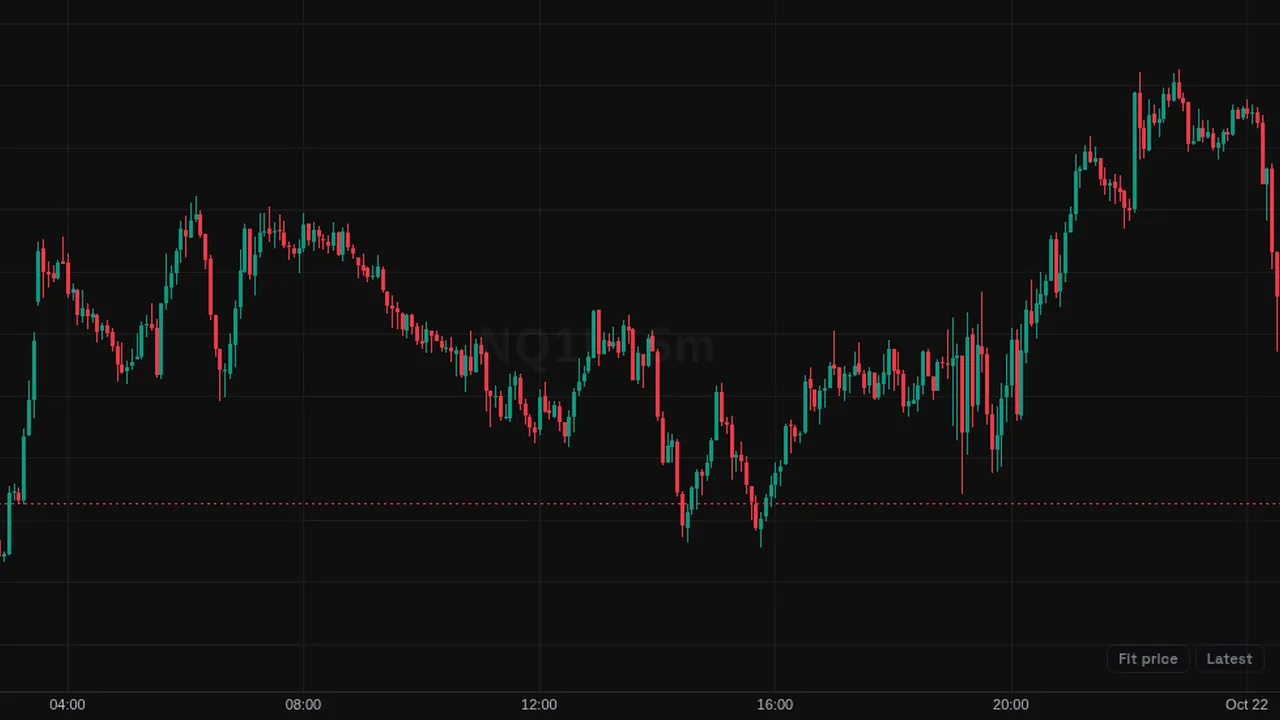
ZigZag: straight lines joining swing highs and lows that reverse by at least 5% with at least 10 bars between pivots.
Overview
The ZigZag connects major swing highs and lows with straight lines on the price chart. Rising legs are green and falling legs are red.
Small moves are filtered out so only the main swings remain.
How it works
A new pivot is confirmed when price reverses from the current leg extreme by at least the deviation (5% of that extreme by default), with at least 10 bars between pivots.
The last leg can change while price is still extending it. Raising the depth spaces pivots further apart; raising the deviation keeps only bigger swings.
How to use it
- Use it to see the main swings of a move without noise.
- Some traders use the pivots to draw trend lines or measure retracements.
- Use it to study the size and length of past swings.
- Lower the deviation for smaller swings.
These are ways some traders read it, for learning. They are not trade signals.
Settings
| Setting | Default |
|---|---|
| Settings | |
| Deviation (%)Minimum reversal from the leg extreme, as a percentage of that extreme, required to confirm a new pivot. | 5 |
| DepthMinimum number of bars required between two consecutive pivots. | 10 |
| Style | |
| Up LegColor of rising zigzag segments. | #089981 |
| Down LegColor of falling zigzag segments. | #f23645 |
| WidthWidth of the zigzag segments. | 2 |
Notes and limits
- Works on any symbol and timeframe; it only needs candle data.
- The last leg can move until a new pivot is confirmed.
- Lines are drawn after the fact; they mark swings that already happened.
Education only. Not financial advice. Indicators mark what happened on the chart; they do not predict what price will do. Trading futures, forex, crypto and other markets carries a high level of risk and may not be suitable for everyone.