
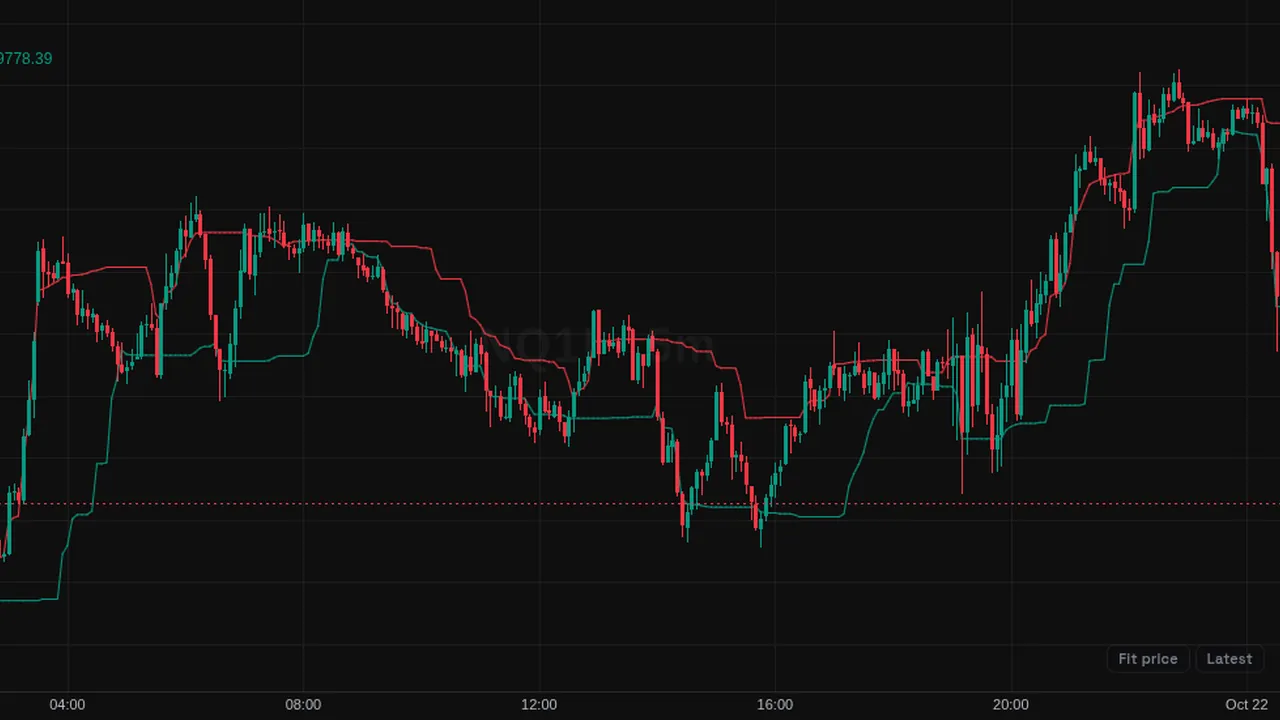
Chande Kroll Stop: long and short stop lines built from ATR offsets of the recent 10-bar highs and lows.
Overview
The Chande Kroll Stop draws two stop lines on the price chart: a long stop in green and a short stop in red.
It is a trend-following stop based on volatility.
How it works
First, preliminary high stop = highest high of 10 bars - 1 x ATR(10), and preliminary low stop = lowest low of 10 bars + 1 x ATR(10).
Then short stop = highest of the preliminary high stops over 9 bars, and long stop = lowest of the preliminary low stops over 9 bars.
How to use it
- Some traders watch price above both lines as a sign of an uptrend.
- Use the lines as trailing stop levels.
- Watch price crossing a line as a possible trend change.
- Adjust the multiplier to make stops looser or tighter.
These are ways some traders read it, for learning. They are not trade signals.
Settings
| Setting | Default |
|---|---|
| Settings | |
| ATR Length (P)Lookback used for both the ATR and the highest high / lowest low price extremes. | 10 |
| ATR Multiplier (X)Multiplier applied to the ATR to offset the preliminary stops from the price extremes. | 1 |
| Stop Length (Q)Lookback over which the preliminary stops are extended into the final stop levels. | 9 |
| Style | |
| Short StopColor of the protective stop line for short positions. | #f23645 |
| Long StopColor of the protective stop line for long positions. | #089981 |
Alerts
You can alert on its line crossing a value or the candle close (from the chart's + menu); checked while ZoroCharts is open.
Notes and limits
- Works on any symbol and timeframe; it only needs candle data.
- Default settings are P = 10, X = 1 and Q = 9; the short stop sits above price and the long stop below in a steady trend.
Education only. Not financial advice. Indicators mark what happened on the chart; they do not predict what price will do. Trading futures, forex, crypto and other markets carries a high level of risk and may not be suitable for everyone.