
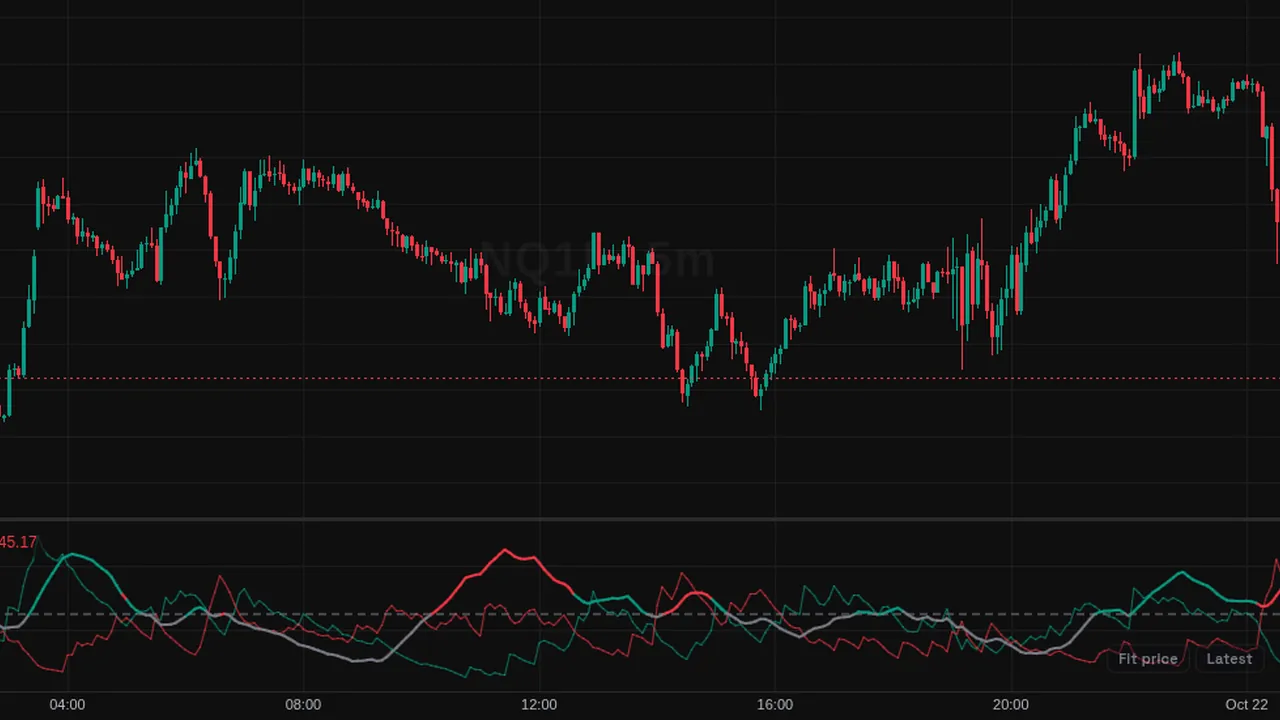
ADX with +DI and -DI: Wilder's directional movement lines and trend strength over 14 bars, key level at 25.
Overview
The Average Directional Index (ADX), by Welles Wilder, shows trend strength in its own pane. +DI (green) and -DI (red) show direction, and the ADX line (gray) shows strength.
A dashed key level sits at 25.
How it works
+DM = high - previous high when that is larger than the down move, else 0. -DM = previous low - low when that is larger, else 0. +DI and -DI = 100 x RMA(DM, 14) / RMA(true range, 14). DX = 100 x |+DI - -DI| / (+DI + -DI). ADX = RMA(DX, 14).
ADX rises in strong trends of either direction.
How to use it
- Some traders read ADX above 25 as a trending market.
- Use +DI above -DI as a sign buyers lead.
- Watch a falling ADX as a sign the trend is weakening.
- Use low ADX to switch to range tools.
These are ways some traders read it, for learning. They are not trade signals.
Settings
| Setting | Default |
|---|---|
| Settings | |
| DI LengthWilder RMA smoothing length applied to directional movement and true range when computing +DI and −DI. | 14 |
| ADX SmoothingWilder RMA smoothing length applied to DX to obtain the ADX line. | 14 |
| Key LevelTrend strength reference level; ADX above it is commonly read as a trending market. | 25 |
| Style | |
| +DI ColorColor of the plus directional indicator, and of the ADX line above the key level while +DI leads. | #089981 |
| −DI ColorColor of the minus directional indicator, and of the ADX line above the key level while −DI leads. | #f23645 |
| ADX ColorColor of the ADX line while it sits below the key level — no trend strong enough to trade. | #787b86 |
Alerts
You can alert on its line crossing a value or the candle close (from the chart's + menu); checked while ZoroCharts is open.
Notes and limits
- Works on any symbol and timeframe; it only needs candle data.
- ADX shows strength, not direction.
Education only. Not financial advice. Indicators mark what happened on the chart; they do not predict what price will do. Trading futures, forex, crypto and other markets carries a high level of risk and may not be suitable for everyone.