
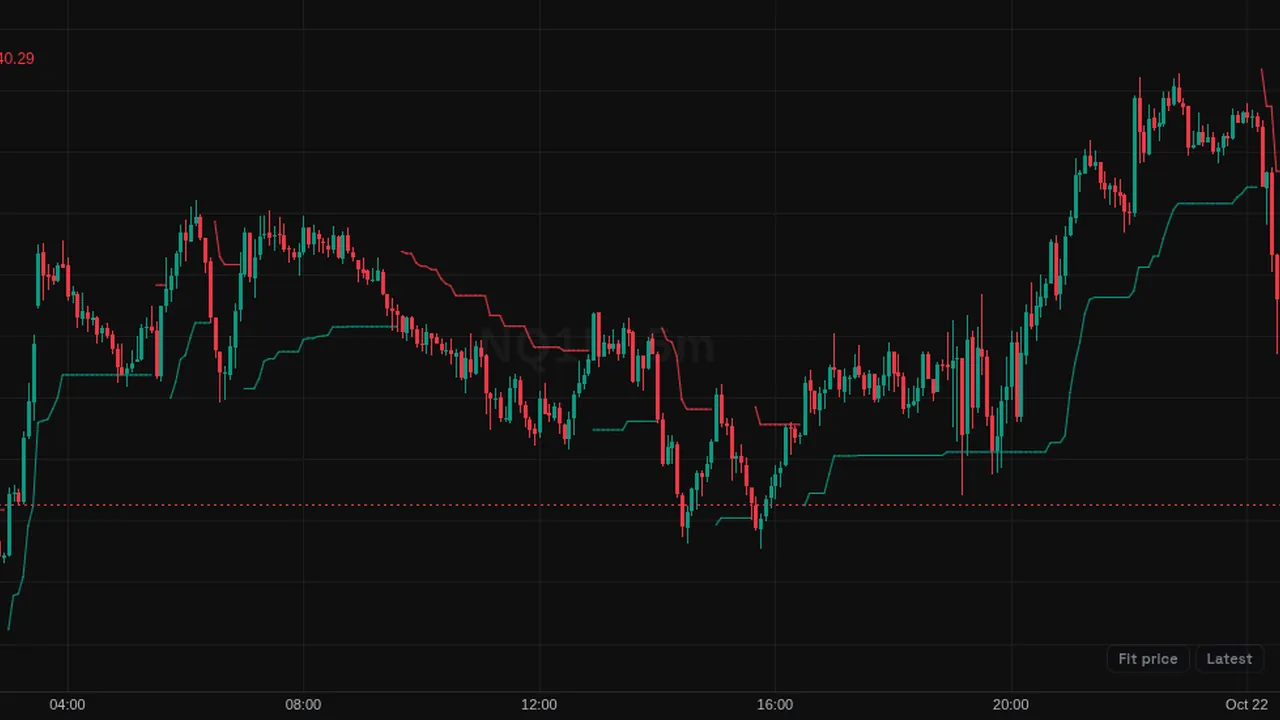
SuperTrend: a trailing line set three 10-bar ATRs from median price, green in uptrends and red in downtrends.
In plain English
What it shows
- SuperTrend draws a line that follows price at a distance set by ATR (average true range, the typical size of a bar). Its colour flips when price closes through it.
How traders use it
- Some traders use the line as a trailing reference for a trend.
- Compare the flips with your own read of the market.
What it does not tell you
- It lags, and flips often in sideways markets.
- It is a description of past price, not a signal.
Overview
SuperTrend draws a single trailing line on the price chart. While the trend is up, the line sits below price in green; while it is down, it sits above in red.
The line switches sides when price closes through it.
How it works
Basic upper band = (high + low) / 2 + 3 x ATR(10). Basic lower band = (high + low) / 2 - 3 x ATR(10). The final lower band can only rise and the upper band can only fall, while the previous close stays on the right side.
The trend turns up when the close goes above the upper band, and down when it goes below the lower band.
How to use it
- Some traders use the line as a trailing stop.
- Use the color change as a sign of a trend change.
- Use a higher factor for fewer flips and a lower factor for more.
- Watch the distance from price to see how stretched the trend is.
These are ways some traders read it, for learning. They are not trade signals.
Settings
| Setting | Default |
|---|---|
| Settings | |
| ATR LengthNumber of bars used to compute the Wilder ATR. | 10 |
| FactorATR multiplier setting how far the trailing stop sits from the bar midpoint. | 3 |
| Style | |
| Uptrend ColorLine color while the trend is up. | #089981 |
| Downtrend ColorLine color while the trend is down. | #f23645 |
Alerts
You can alert on its line crossing a value or the candle close (from the chart's + menu); checked while ZoroCharts is open.
Notes and limits
- Works on any symbol and timeframe; it only needs candle data.
- It can flip often in ranges.
Education only. Not financial advice. Indicators mark what happened on the chart; they do not predict what price will do. Trading futures, forex, crypto and other markets carries a high level of risk and may not be suitable for everyone.