
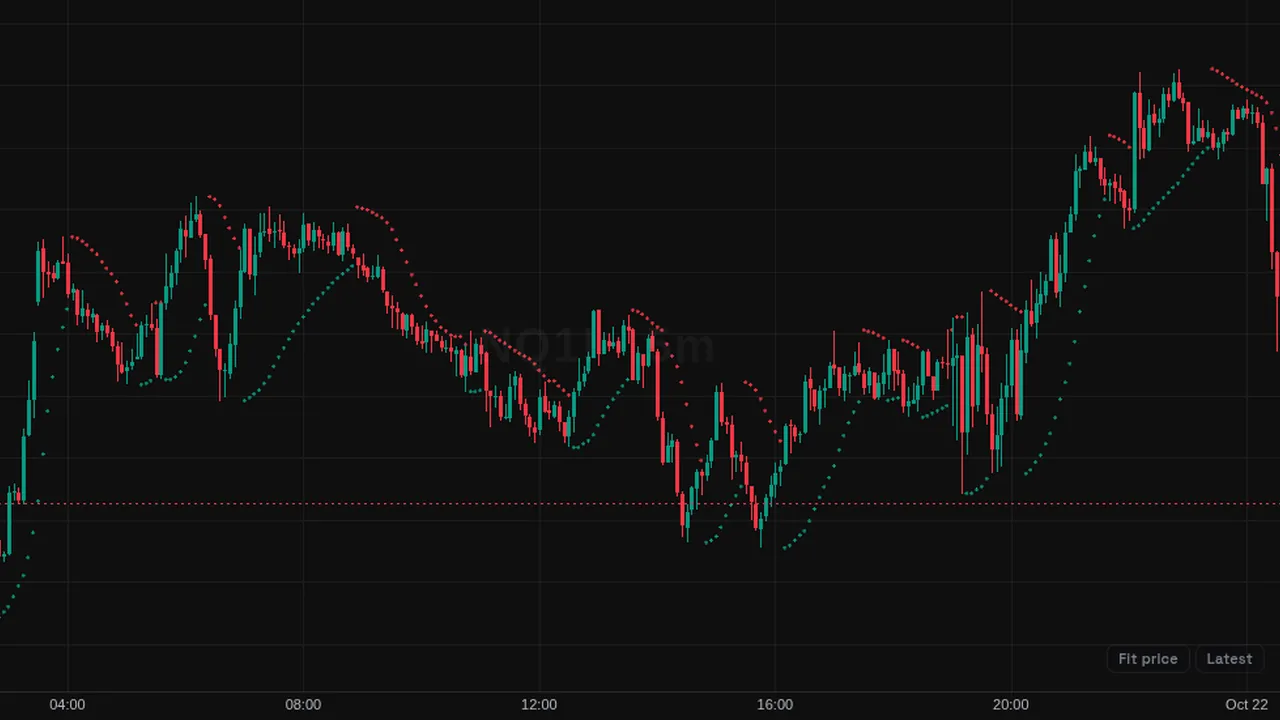
Parabolic SAR: Wilder's stop-and-reverse dots that trail price and speed up as the trend extends.
Overview
The Parabolic SAR, by Welles Wilder, plots dots above or below the candles. Dots below price (green) mean an uptrend; dots above price (red) mean a downtrend.
When price crosses the dots, they flip to the other side.
How it works
SAR next = SAR + AF x (EP - SAR). EP is the extreme point of the trend (highest high in an uptrend, lowest low in a downtrend). AF starts at 0.02, adds 0.02 each time a new extreme is made, and stops at 0.2.
On a flip, SAR resets to the previous extreme point and AF resets to the start.
How to use it
- Some traders use the dots as a trailing stop.
- Use the flip as a sign of a possible trend change.
- Watch the gap between price and dots to see how extended the trend is.
- Pair it with a trend strength tool to avoid flips in ranges.
These are ways some traders read it, for learning. They are not trade signals.
Settings
| Setting | Default |
|---|---|
| Settings | |
| StartInitial acceleration factor applied when a new trend begins. | 0.02 |
| IncrementAmount added to the acceleration factor each time the trend makes a new extreme point. | 0.02 |
| MaximumUpper cap on the acceleration factor. | 0.2 |
| Style | |
| BullishColor of the SAR crosses while they trail below price — uptrend, the stop sits under the market. | #089981 |
| BearishColor of the SAR crosses while they sit above price — downtrend, the stop sits over the market. | #f23645 |
Alerts
You can alert on its line crossing a value or the candle close (from the chart's + menu); checked while ZoroCharts is open.
Notes and limits
- Works on any symbol and timeframe; it only needs candle data.
- It flips often in sideways markets.
Education only. Not financial advice. Indicators mark what happened on the chart; they do not predict what price will do. Trading futures, forex, crypto and other markets carries a high level of risk and may not be suitable for everyone.