
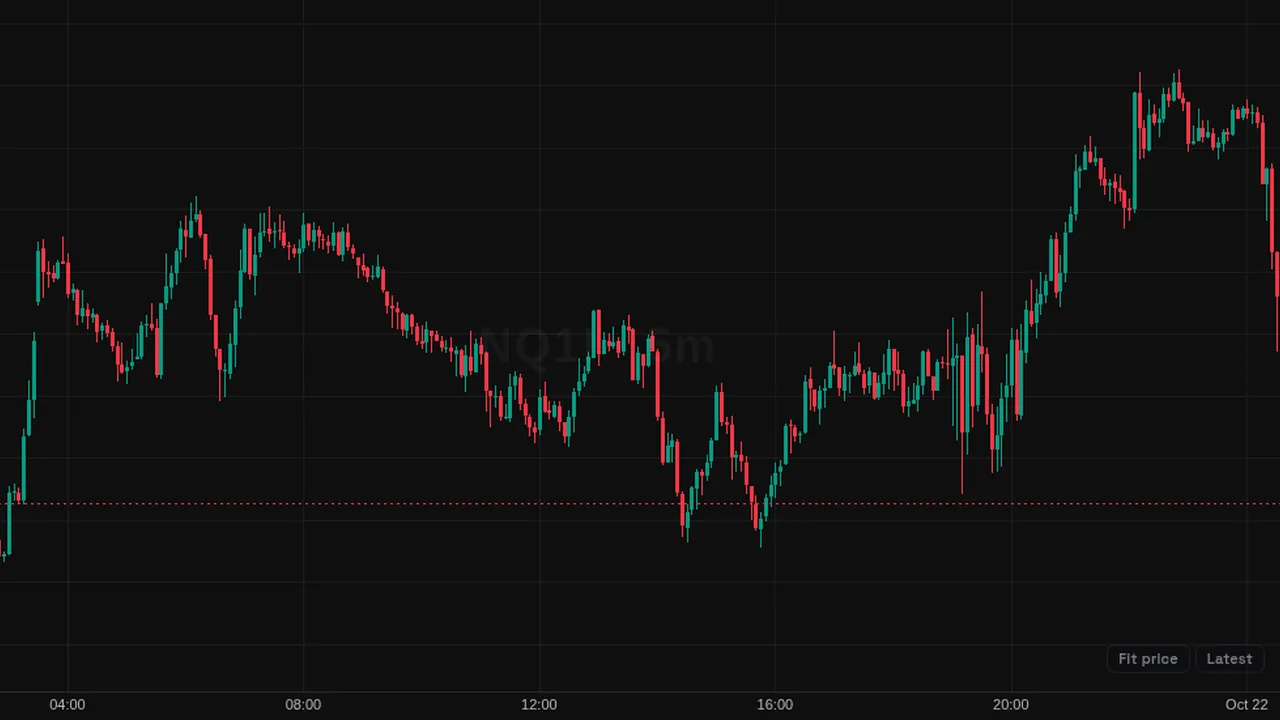
Williams Fractals: markers above swing highs and below swing lows that stand out from two bars on each side.
Overview
Williams Fractals mark local turning points on the price chart. An up fractal (red, above the bar) marks a swing high; a down fractal (green, below the bar) marks a swing low.
They were made popular by Bill Williams.
How it works
With Periods = 2, an up fractal is a bar whose high is higher than the two bars before and the two bars after. A down fractal is a bar whose low is lower than the two bars on each side.
A fractal is only confirmed once the later bars have closed, so it appears two bars after the swing. Larger Periods values need more bars on each side, so fewer swings qualify.
How to use it
- Some traders use fractals as levels for breakouts.
- Use them to place stops beyond the last swing.
- Pair them with the Alligator as in Williams' method.
- Increase Periods for fewer, larger swings.
These are ways some traders read it, for learning. They are not trade signals.
Settings
| Setting | Default |
|---|---|
| Settings | |
| PeriodsBars required on each side of the candidate bar. 2 is Bill Williams' classic 5-bar fractal; a fractal is confirmed only once this many later bars have closed. | 2 |
| Style | |
| Up FractalColor of the up fractal marker (swing high), drawn above the fractal bar. | #f23645 |
| Down FractalColor of the down fractal marker (swing low), drawn below the fractal bar. | #089981 |
Notes and limits
- Works on any symbol and timeframe; it only needs candle data.
- Markers appear after a delay of Periods bars.
- Many fractals appear in ranges; larger periods reduce them.
Education only. Not financial advice. Indicators mark what happened on the chart; they do not predict what price will do. Trading futures, forex, crypto and other markets carries a high level of risk and may not be suitable for everyone.