
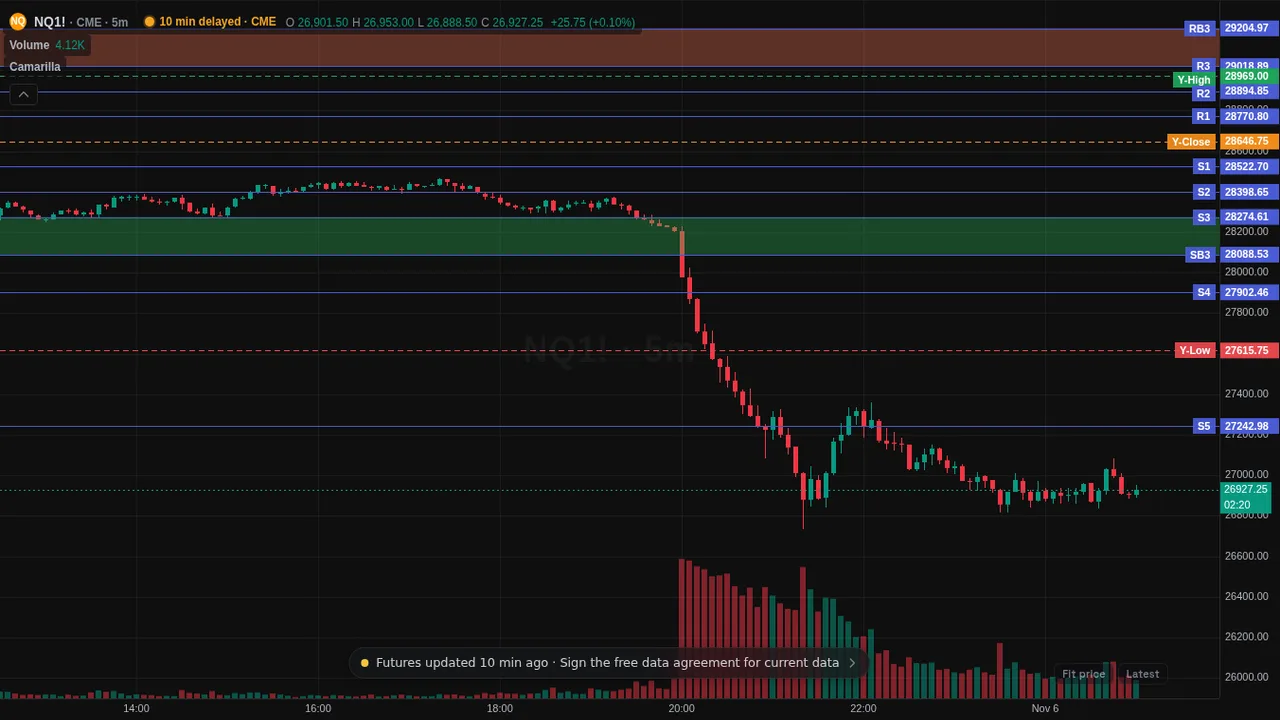
Draws the Camarilla levels R5 to S5, Y-High, Y-Close and Y-Low from the prior day, week or month, with shaded reversal zones.
Overview
Camarilla Pivots draws a ladder of price levels worked out from the previous session's high, low and close. You see R5, R4, RB3, R3, R2 and R1 above, Y-High, Y-Close and Y-Low in the middle, and S1, S2, S3, SB3, S4 and S5 below.
The R/S levels are solid lines, Y-High is dashed green, Y-Low is dashed red and Y-Close is dashed orange. The space between R3 and RB3 is shaded red and the space between S3 and SB3 is shaded green. Each day's levels run from the start of the session to its end, and today's run to the right edge. Name tags sit at the right end and price tags on the price axis.
How it works
Range is the prior session's high minus its low. R4, R3, R2 and R1 are the prior close plus Range x 1.1 divided by 2, 4, 6 and 12. S1 to S4 mirror them below the close. R5 is high divided by low, times the close, and S5 is the close minus the distance from the close to R5. RB3 and SB3 are the midpoints of R3 and R4, and of S3 and S4.
On futures a session is the exchange day, 18:00 to 17:00 New York time. On stocks, crypto and forex it is the UTC day. Weekly and Monthly use the prior week or month instead. Everything is calculated from the bars on your chart, so the chart needs enough history to hold the previous session.
How to use it
- Some traders watch how price reacts when it reaches the shaded R3 to RB3 or S3 to SB3 zones.
- Use Y-High, Y-Close and Y-Low to see where price is trading against yesterday's range.
- Switch on only the groups you want, such as R3/S3 and R4/S4, to keep the chart clean.
- Show a few past days to see how earlier levels lined up with later price.
These are ways some traders read it, for learning. They are not trade signals.
Settings
| Setting | Default |
|---|---|
| TimeframeOptions: Daily, Weekly, Monthly | Daily |
| Past sessions to show | 5 |
| R5 / S5 | On |
| R4 / S4 | On |
| R3 / S3 (and RB3 / SB3) | On |
| Shade the R3-RB3 and S3-SB3 zones | On |
| R2 / S2 | On |
| R1 / S1 | On |
| Y-High | On |
| Y-Close | On |
| Y-Low | On |
| Labels | On |
Show all 20 settings
| Setting | Default |
|---|---|
| Price tags on the axis | On |
| Line width | 1 |
| R / S line colour | #4a5bd4 |
| Y-High colour | #1fa35a |
| Y-Close colour | #f08c1b |
| Y-Low colour | #e5484d |
| Resistance zone colour | #ff7a59 |
| Support zone colour | #2fbf5b |
Notes and limits
- Made for intraday charts. On a daily or longer chart it shows only the newest set of levels.
- You can set the timeframe, the number of past days, colours, line width, labels and price tags.
- It marks levels, not signals. Education only. Not financial advice.
Education only. Not financial advice. Indicators mark what happened on the chart; they do not predict what price will do. Trading futures, forex, crypto and other markets carries a high level of risk and may not be suitable for everyone.