
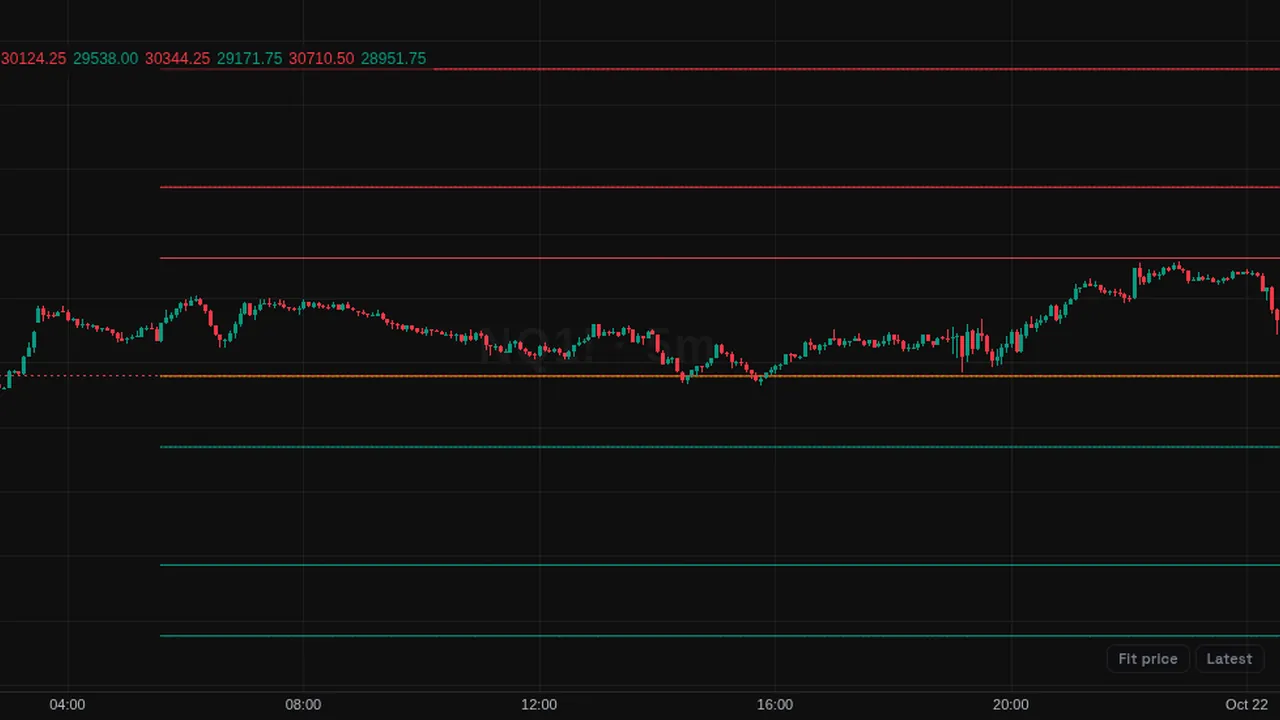
Classic pivot points with support and resistance levels from the prior period: Traditional, Fibonacci, Camarilla or Woodie.
Overview
Pivot Points draw a central pivot (P) with resistance (R) levels above and support (S) levels below, for each period on the price chart.
The pivot is orange, resistances red and supports green.
How it works
Traditional: P = (high + low + close) / 3 of the prior period. R1 = 2P - low, S1 = 2P - high, R2 = P + (high - low), S2 = P - (high - low), and so on. Fibonacci adds 38.2%, 61.8% and 100% of the prior range to P. Camarilla scales the range around the prior close. Woodie weights the close more.
Auto timeframe uses daily pivots up to 15-minute bars, weekly on other intraday bars, monthly on daily bars, and yearly above.
How to use it
- Some traders watch P as the line between bullish and bearish bias for the period.
- Use R and S levels as areas where price may react.
- Compare types to see which levels match the symbol's swings.
- Use weekly or monthly pivots for a wider view.
These are ways some traders read it, for learning. They are not trade signals.
Settings
| Setting | Default |
|---|---|
| Settings | |
| TypeFormula used to calculate the levels. Traditional is the classic floor-trader method; Fibonacci projects 38.2/61.8/100% of the prior range around the pivot; Camarilla scales the prior range around the prior close; Woodie gives extra weight to the period open.Options: Traditional, Fibonacci, Camarilla, Woodie | Traditional |
| Pivots TimeframePeriod the pivots are anchored to. Auto follows the chart's timeframe: daily pivots up to 15-minute bars, weekly on other intraday bars, monthly on daily bars, yearly above.Options: Auto, Daily, Weekly, Monthly, Yearly | Auto |
| Style | |
| PivotColor of the central pivot (P) level. | #ff9800 |
| ResistancesColor of the resistance (R) levels. | #f23645 |
| SupportsColor of the support (S) levels. | #089981 |
Notes and limits
- Works on any symbol and timeframe; it only needs candle data.
- Levels are fixed for the period once it starts.
Education only. Not financial advice. Indicators mark what happened on the chart; they do not predict what price will do. Trading futures, forex, crypto and other markets carries a high level of risk and may not be suitable for everyone.