
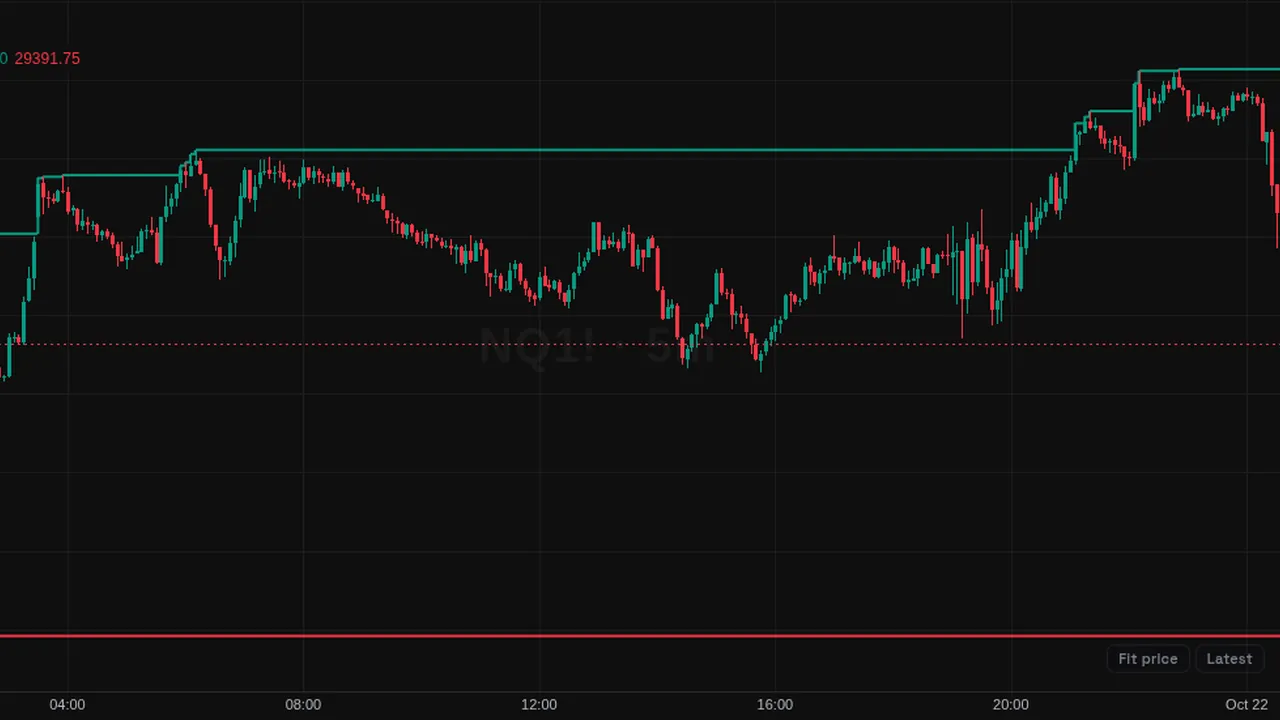
The rolling 52-week high and low drawn as levels on the chart, with an optional all-time high and low.
Overview
This study draws the highest high and lowest low of the last 52 weeks as lines on the price chart. The high is green and the low red.
You can also show the all-time high and low across the loaded history.
How it works
The window is a rolling span of 52 weeks in time, not a bar count, so it works on any timeframe. The all-time levels track the symbol's full loaded history.
The number of weeks can be changed.
How to use it
- Some traders watch the 52-week high as a breakout level.
- Use the distance to each level to see where price sits in its yearly range.
- Watch reactions near the 52-week low as signs of support.
- Use the all-time high to see if price is in new territory.
These are ways some traders read it, for learning. They are not trade signals.
Settings
| Setting | Default |
|---|---|
| Settings | |
| WeeksLength of the rolling window, in weeks. | 52 |
| Show All-Time High/LowAdditionally display the all-time high and low, tracked over the symbol's full loaded history. | Off |
| Style | |
| 52-Week HighColor of the 52-week high level. | #089981 |
| 52-Week LowColor of the 52-week low level. | #f23645 |
| All-Time High/LowColor of the all-time high and all-time low levels. | #787b86 |
Alerts
You can alert on its line crossing a value or the candle close (from the chart's + menu); checked while ZoroCharts is open.
Notes and limits
- Works on any symbol and timeframe.
- The all-time levels depend on how much history is loaded.
Education only. Not financial advice. Indicators mark what happened on the chart; they do not predict what price will do. Trading futures, forex, crypto and other markets carries a high level of risk and may not be suitable for everyone.