
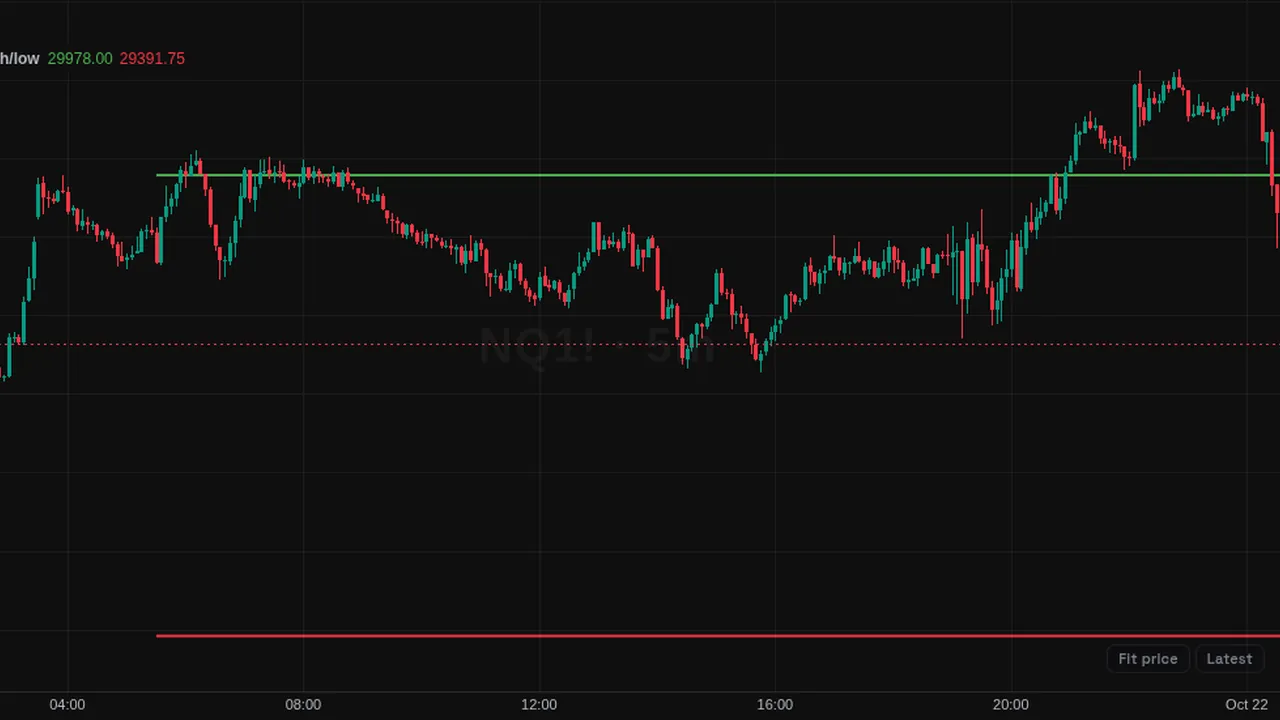
Tracks each day's high and low and draws the previous day's high in green and low as step lines on the chart.
Overview
Previous day high/low is a short example Pine script. It draws the prior day's high and low as flat step lines on the price chart, so you can see yesterday's range while today trades.
How it works
The script tracks the highest high and lowest low of the current day. When a new day starts, those values become the previous day's high and low, and the tracking starts again. The lines stay flat for the whole day and step to the new values at the next day.
How to use it
- Some traders watch how price reacts at the previous day's high or low.
- Use it to see whether today is trading inside or outside yesterday's range.
- Some traders watch for a break and close beyond either level.
- Use it as an example of how Pine scripts carry values from one day to the next.
These are ways some traders read it, for learning. They are not trade signals.
Settings
This tool has no settings: you add it, then click or drag on the chart.
Notes and limits
- The day boundary follows the chart's daily session.
- There are no settings and no alert conditions.
Education only. Not financial advice. Indicators mark what happened on the chart; they do not predict what price will do. Trading futures, forex, crypto and other markets carries a high level of risk and may not be suitable for everyone.