
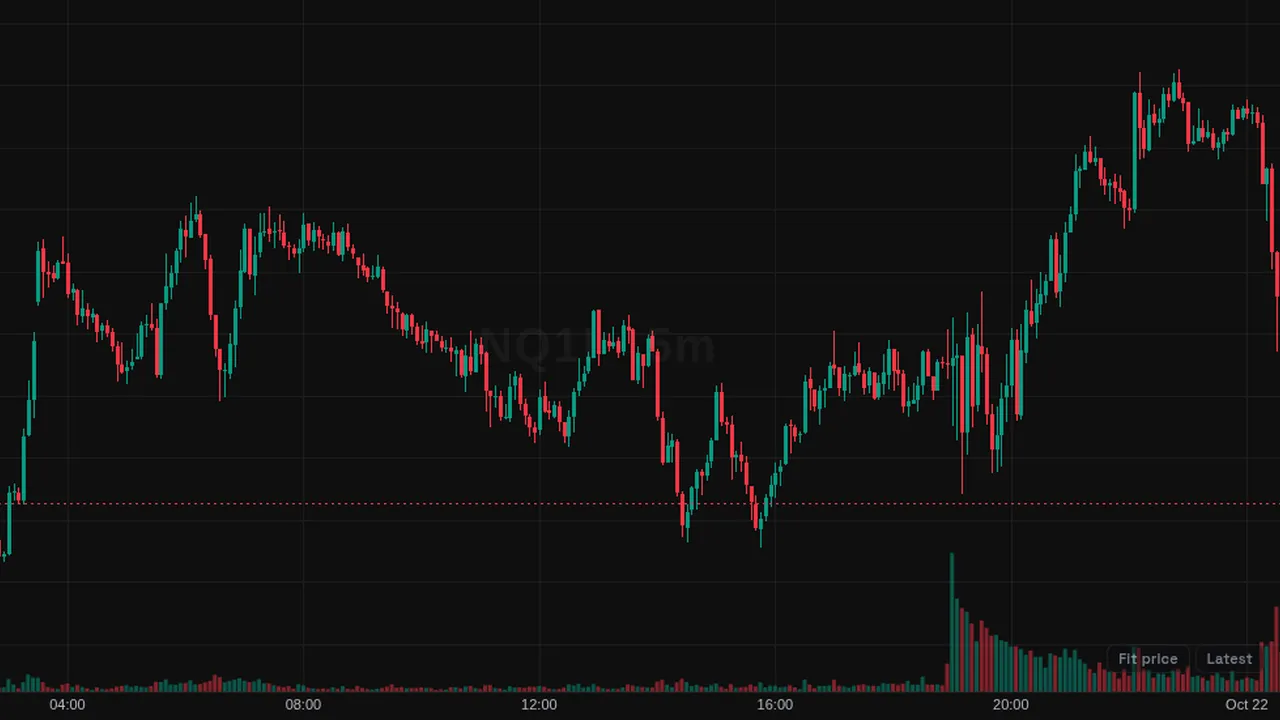
Volume bars at the bottom of the price chart, green on up candles and red on down candles.
Overview
The Volume study draws a bar for each candle along the bottom of the price pane. Bars are green when the candle closed up and red when it closed down.
The tallest visible bar takes 20% of the pane height by default, so volume stays out of the way of price.
How it works
Each bar is the traded volume of that candle as supplied by the chart's data. The bars are rescaled to the visible range as you scroll or zoom.
Only the colors and the height can be changed.
How to use it
- Some traders watch for volume spikes at breakouts or reversals.
- Use low volume on pullbacks as a sign of less selling or buying interest.
- Compare volume at highs and lows to see where activity was heavier.
- Use it with volume tools such as OBV or a volume profile.
These are ways some traders read it, for learning. They are not trade signals.
Settings
| Setting | Default |
|---|---|
| Up color | #089981 |
| Down color | #f23645 |
| Height %Panel height the tallest visible bar occupies. | 20 |
Notes and limits
- It needs volume data; on symbols without volume it shows nothing useful.
- Volume differs by data source and market; for some markets it is tick or reported volume.
Education only. Not financial advice. Indicators mark what happened on the chart; they do not predict what price will do. Trading futures, forex, crypto and other markets carries a high level of risk and may not be suitable for everyone.