
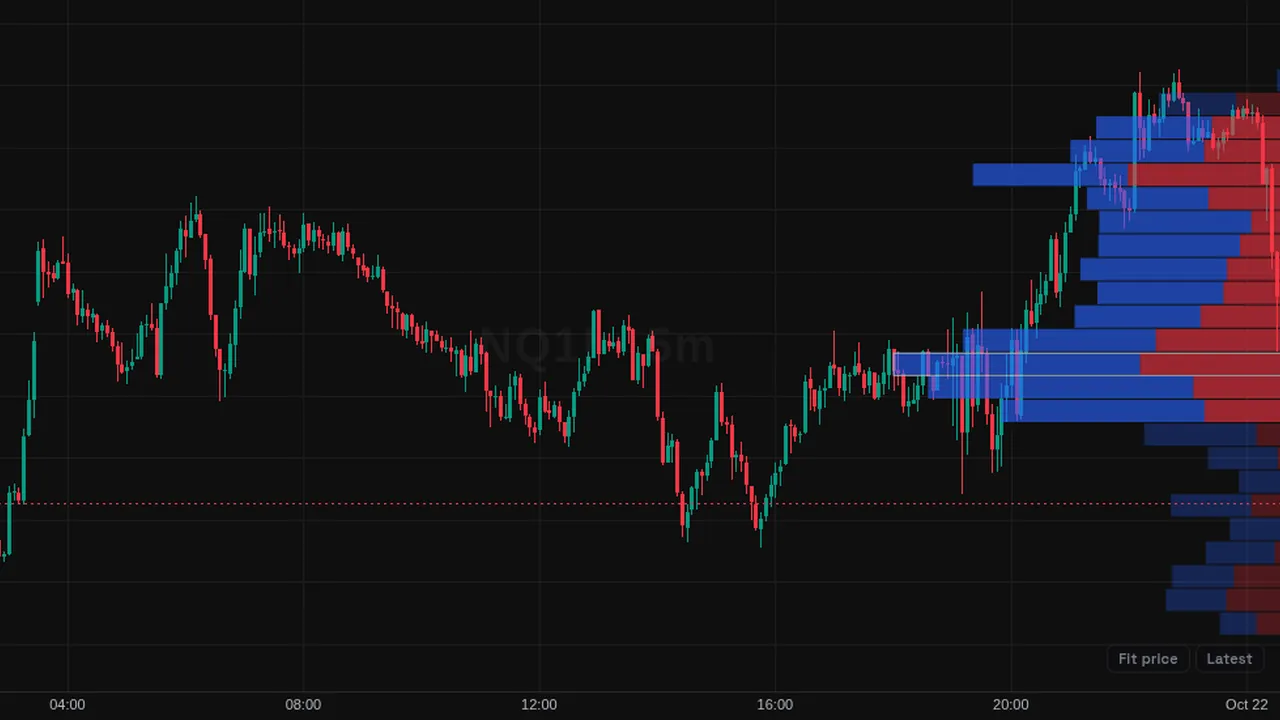
Volume profile for the visible chart: horizontal volume rows by price, with a point of control and a 70% value area.
Overview
The Visible Range Volume Profile shows how much volume traded at each price level for the bars on screen. It draws horizontal rows on the side of the price chart; longer rows mean more volume at that price.
Each row is split into up and down volume. The point of control (POC) marks the price with the most volume, and the value area shades the range that holds 70% of it.
How it works
The visible price range is split into 24 rows by default. Each bar's volume is added to the rows it covers, split by up or down candle. The largest row fills 30% of the panel width.
The value area grows out from the POC until it holds the chosen share of volume. The profile is rebuilt every time you scroll or zoom.
How to use it
- Some traders watch the POC as a level price may return to.
- Use the value area edges as reference areas for the range.
- Use thin rows (low volume) to see prices price moved through quickly.
- Zoom to one session to see that session's profile.
These are ways some traders read it, for learning. They are not trade signals.
Settings
| Setting | Default |
|---|---|
| Rows | 24 |
| Width %Panel width the largest row occupies. | 30 |
| Up color | #2962ff |
| Down color | #f23645 |
| Point of control | On |
| Value area % | 70 |
Notes and limits
- It needs volume data; on symbols without volume it shows nothing useful.
- Volume is spread across each candle's range, so it is an estimate from bars, not trade-by-trade data.
- The profile changes as the visible range changes.
Education only. Not financial advice. Indicators mark what happened on the chart; they do not predict what price will do. Trading futures, forex, crypto and other markets carries a high level of risk and may not be suitable for everyone.