
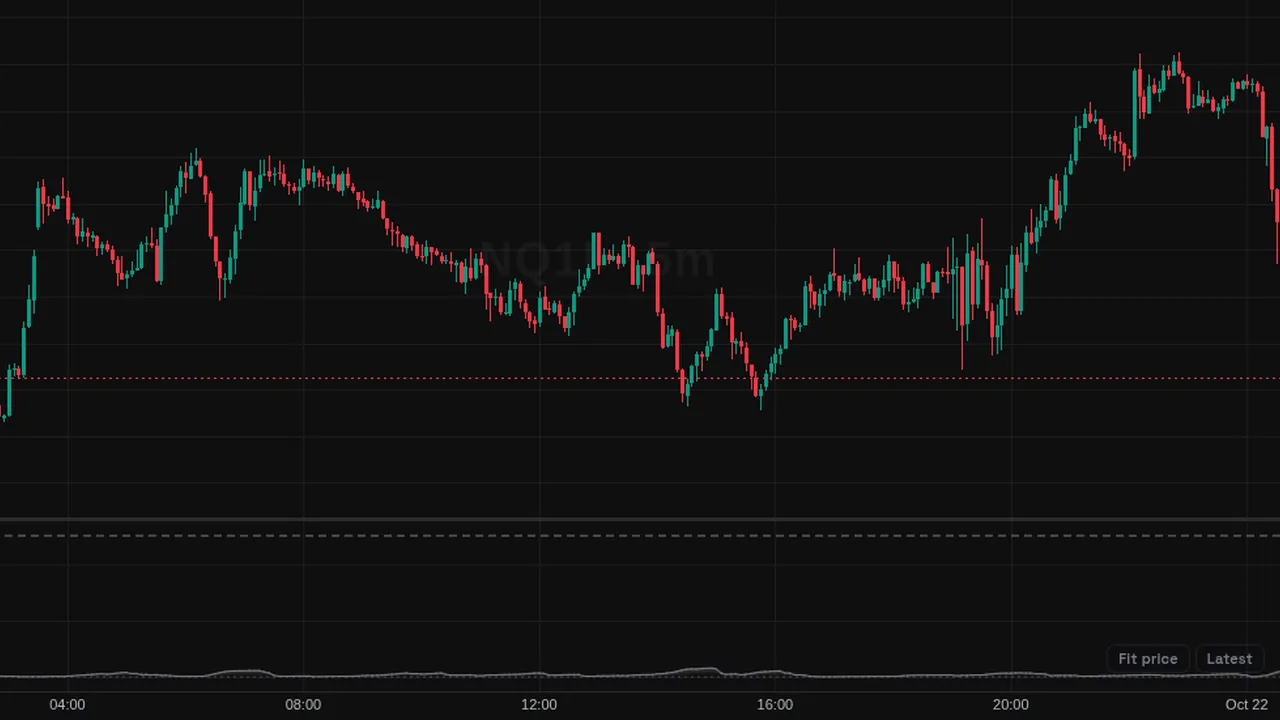
Ulcer Index: the root-mean-square of percent drawdowns from the 14-bar high, with a stress level at 5.
Overview
The Ulcer Index measures downside risk in its own pane. It rises when price falls from recent highs and stays down, and it stays near zero in steady uptrends.
A dashed stress line sits at 5 by default, and the line shifts to red as it nears that level. Drawdown columns can be shown too.
How it works
At each bar, percent drawdown = (close - highest close of 14 bars) / highest close x 100. Square these values, average them over 14 bars and take the square root.
Deeper and longer drops raise the index more than short, shallow ones.
How to use it
- Use it to see how painful recent declines have been.
- Some traders compare the index across symbols to judge downside risk.
- Watch readings above the stress line as deep or long drawdowns.
- Use it with trend tools to see if a pullback is getting larger.
These are ways some traders read it, for learning. They are not trade signals.
Settings
| Setting | Default |
|---|---|
| Settings | |
| LengthLookback window. At each bar the percentage drawdown from the window's running maximum is squared; the squares are averaged and the root taken. | 14 |
| SourcePrice series the Ulcer Index is computed on. Close is the standard choice.Options: Close, Open, High, Low, HL2, HLC3, OHLC4, HLCC4 | Close |
| Stress ThresholdReference level drawn as a dashed line. The index scales with the instrument's volatility and the window length, so set it relative to its own history. | 5 |
| Style | |
| Ulcer IndexColor of the index near zero; it blends toward the stress color as the reading approaches the threshold. | #787b86 |
| StressColor of the index at and beyond the stress threshold. | #f23645 |
| Gradient FillVertical gradient between zero and the Ulcer Index, fully transparent at zero. | On |
| Drawdown %Plot the current percentage drawdown from the window high as columns below zero — the raw ingredient the index averages. | Off |
| Drawdown ColorColor of the drawdown columns. | #f2364580 |
| ThresholdColor of the stress threshold line. | #787b86 |
Alerts
You can alert on its line crossing a value or the candle close (from the chart's + menu); checked while ZoroCharts is open.
Notes and limits
- Works on any symbol and timeframe; it only needs candle data.
- It only looks at drops from highs, not upside moves.
Education only. Not financial advice. Indicators mark what happened on the chart; they do not predict what price will do. Trading futures, forex, crypto and other markets carries a high level of risk and may not be suitable for everyone.