
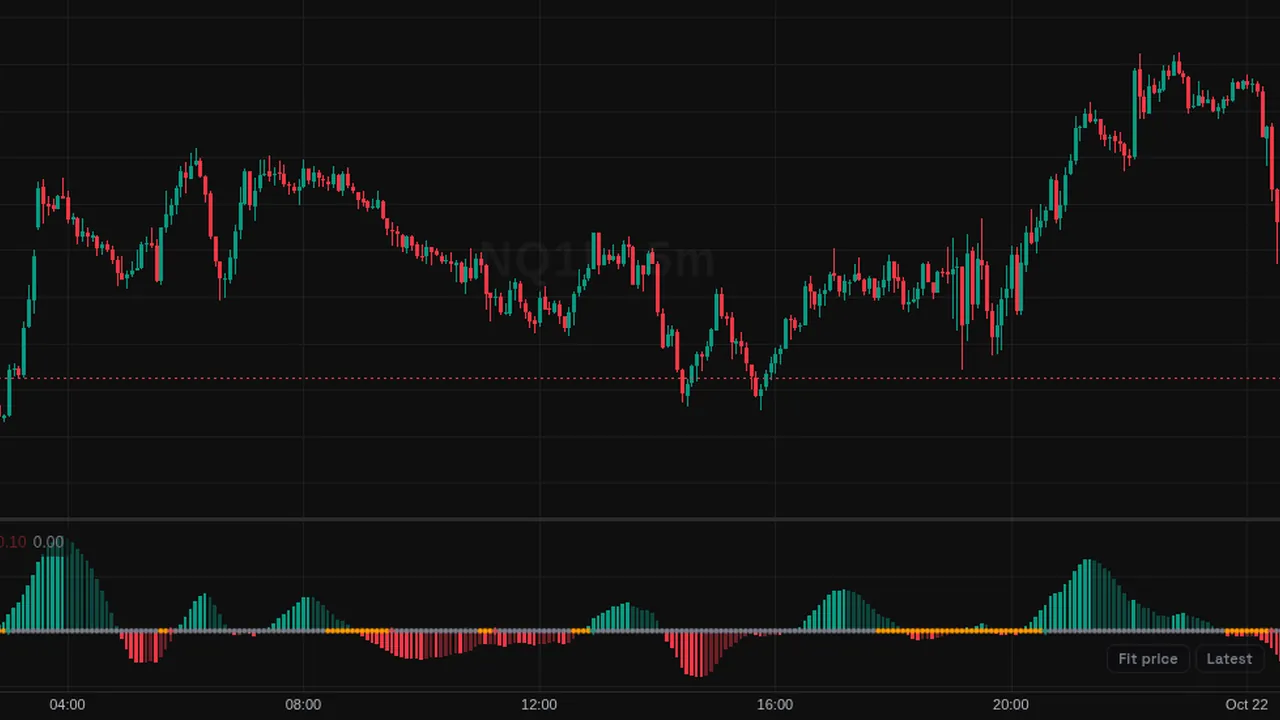
TTM Squeeze: momentum histogram with dots that show when Bollinger Bands sit inside Keltner Channels.
Overview
The TTM Squeeze, by John Carter, shows two things in its own pane. A histogram shows momentum, and dots on the zero line show whether the market is in a squeeze.
Orange dots mean the squeeze is on; gray dots mean it is off. A cross on the zero line marks the first bar after a squeeze ends (a fire).
How it works
Squeeze is on when both Bollinger Bands (20 bars, 2 deviations) are inside the Keltner Channels (20 bars, 1.5 ATR).
Momentum is a linear regression of price minus the average of the Donchian midline and the SMA over 20 bars. Bars are solid when building away from zero and dim when fading back.
How to use it
- Some traders watch for the first gray dot after a run of orange dots.
- Use the histogram color to see momentum direction at the fire.
- Watch for momentum fading as a sign a move is slowing.
- Use a long squeeze as a sign of building pressure.
These are ways some traders read it, for learning. They are not trade signals.
Settings
| Setting | Default |
|---|---|
| Settings | |
| LengthShared lookback for the Bollinger Bands, the Keltner Channels, and the momentum regression. John Carter's original setting is 20. | 20 |
| SourcePrice series used for the shared moving average basis, the standard deviation, and the momentum displacement.Options: Close, Open, High, Low, HL2, HLC3, OHLC4, HLCC4 | Close |
| Bollinger Bands MultiplierStandard deviation multiplier for the Bollinger Bands. | 2 |
| Keltner Channels MultiplierATR multiplier for the Keltner Channels. A smaller multiplier demands a tighter compression before the squeeze turns on. | 1.5 |
| Style | |
| Momentum UpHistogram color while momentum is positive. Bars building away from zero print solid, bars fading back print dimmed. | #089981 |
| Momentum DownHistogram color while momentum is negative. Bars building away from zero print solid, bars fading back print dimmed. | #f23645 |
| Squeeze OnZero-line dot color while both Bollinger Bands sit fully inside the Keltner Channels. | #ff9800 |
| Squeeze OffZero-line dot color while the Bollinger Bands trade outside the Keltner Channels. | #787b86 |
| Mark Squeeze FiresDraws a cross on the zero line on the first bar where the bands re-emerge outside the channels, colored by the side of the momentum histogram. | On |
Alerts
You can alert on its line crossing a value or the candle close (from the chart's + menu); checked while ZoroCharts is open.
Notes and limits
- Works on any symbol and timeframe; it only needs candle data.
Education only. Not financial advice. Indicators mark what happened on the chart; they do not predict what price will do. Trading futures, forex, crypto and other markets carries a high level of risk and may not be suitable for everyone.