
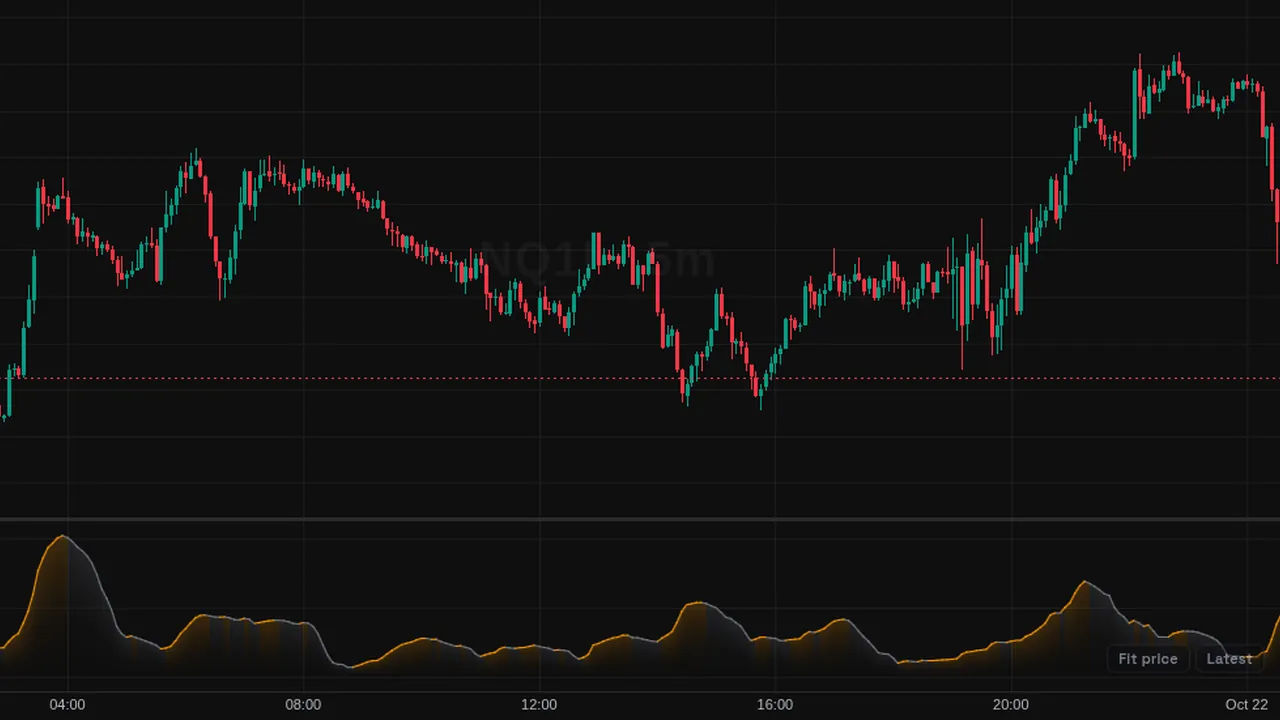
Standard deviation of the close over 20 bars, a simple measure of how widely price is spread around its average.
Overview
This study plots the standard deviation of price in its own pane. Higher values mean price is spread wider around its average; lower values mean it is tightly packed.
The line turns orange while it is expanding.
How it works
Standard deviation = square root of the average squared distance of each value from the 20-bar mean.
It is the same measure used to build Bollinger Bands. A larger length gives a slower, smoother line; a shorter one reacts faster.
How to use it
- Use it to see when volatility is rising or falling.
- Some traders watch for very low readings as a sign of a coming expansion.
- Use it to scale stops or bands to current conditions.
- Compare it with ATR to see two views of volatility.
These are ways some traders read it, for learning. They are not trade signals.
Settings
| Setting | Default |
|---|---|
| Settings | |
| LengthNumber of bars used to compute the standard deviation. | 20 |
| SourcePrice series the standard deviation is calculated on.Options: Close, Open, High, Low, HL2, HLC3, OHLC4, HLCC4 | Close |
| Style | |
| Standard DeviationLine color while volatility contracts or holds flat. | #787b86 |
| ExpandingLine and fill color while volatility expands bar to bar. | #ff9800 |
Alerts
You can alert on its line crossing a value or the candle close (from the chart's + menu); checked while ZoroCharts is open.
Notes and limits
- Works on any symbol and timeframe; it only needs candle data.
- Values are in price units, so they differ across symbols.
- It treats moves up and down the same way.
Education only. Not financial advice. Indicators mark what happened on the chart; they do not predict what price will do. Trading futures, forex, crypto and other markets carries a high level of risk and may not be suitable for everyone.