
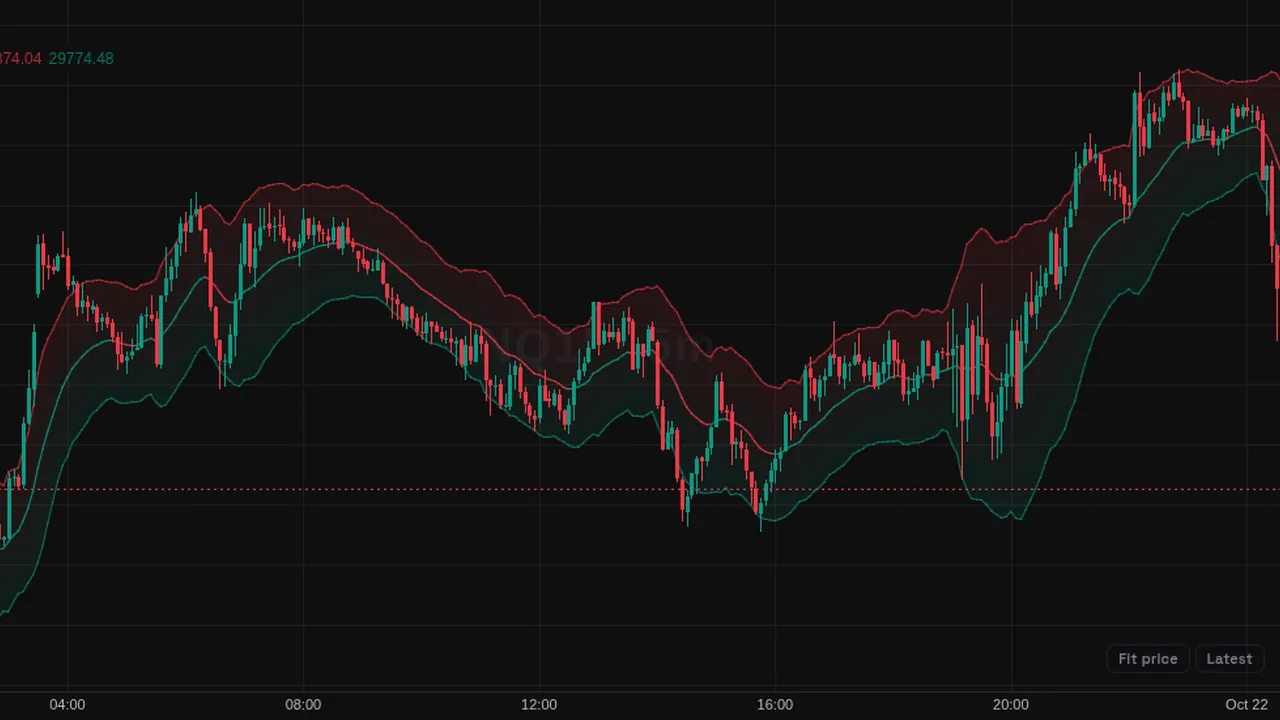
Keltner Channels: a 20-bar EMA of the close with bands set two times the 10-bar ATR above and below it.
Overview
Keltner Channels draw a middle EMA with an upper and lower band on the price chart. The bands widen with volatility, measured by ATR.
Colors follow direction: bullish and bearish colors with a gray basis.
How it works
Basis = EMA(close, 20). Upper = basis + 2 x ATR(10). Lower = basis - 2 x ATR(10).
Because it uses ATR, the bands are usually smoother than Bollinger Bands. Length, ATR length, multiplier and source can be changed.
How to use it
- Some traders watch closes outside a band as a sign of a strong move.
- Use the basis as a level for pullbacks in a trend.
- Compare with Bollinger Bands to spot squeezes (as in the TTM Squeeze).
- Use the band width to see changes in volatility.
These are ways some traders read it, for learning. They are not trade signals.
Settings
| Setting | Default |
|---|---|
| Settings | |
| EMA LengthNumber of bars used to compute the exponential moving average basis line. | 20 |
| ATR LengthNumber of bars used to compute the Average True Range (Wilder smoothing). | 10 |
| MultiplierATR multiple used to offset the upper and lower bands from the basis line. | 2 |
| SourcePrice series used to compute the basis line.Options: Close, Open, High, Low, HL2, HLC3, OHLC4, HLCC4 | Close |
| Style | |
| BullishColor of the lower band and of the basis while price holds above it. | #089981 |
| BearishColor of the upper band and of the basis while price sits below it. | #f23645 |
| Basis ColorColor of the basis line while price sits exactly on it. | #787b86 |
Alerts
You can alert on its line crossing a value or the candle close (from the chart's + menu); checked while ZoroCharts is open.
Notes and limits
- Works on any symbol and timeframe; it only needs candle data.
- Wider multipliers mean fewer closes outside the bands.
Education only. Not financial advice. Indicators mark what happened on the chart; they do not predict what price will do. Trading futures, forex, crypto and other markets carries a high level of risk and may not be suitable for everyone.