
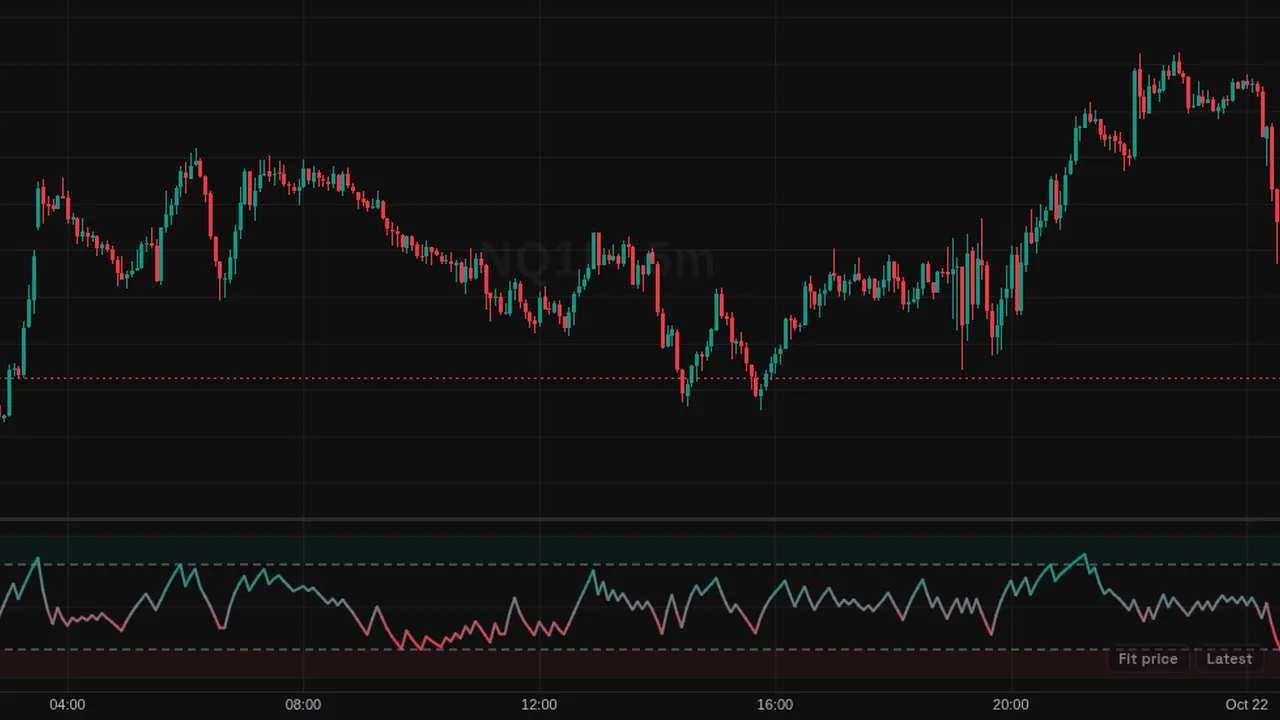
Relative Volatility Index: an RSI-style line built from 10-bar standard deviation on up and down closes, levels at 80 and 20.
Overview
The Relative Volatility Index (RVI), by Donald Dorsey, looks like RSI but uses volatility instead of price change. It plots from 0 to 100 in its own pane with levels at 80 and 20.
It shows whether volatility has been higher on up bars or on down bars.
How it works
For each bar, take the 10-bar standard deviation of close. On up closes it goes into the up stream, on down closes into the down stream. Smooth each stream over 14 bars with an EMA (or Wilder RMA).
RVI = 100 x up / (up + down).
How to use it
- Some traders use RVI to confirm signals from other tools, as Dorsey intended.
- Use readings above 50 as more volatility on up bars.
- Watch moves above 80 or below 20 as one-sided volatility.
- Compare with RSI to see if volatility agrees with momentum.
These are ways some traders read it, for learning. They are not trade signals.
Settings
| Setting | Default |
|---|---|
| Settings | |
| Stdev LengthNumber of bars used for the standard deviation of closing prices that serves as each bar's volatility reading. | 10 |
| Smoothing LengthNumber of bars used to smooth the up and down volatility streams. | 14 |
| Smoothing TypeMoving average applied to the volatility streams. EMA is Dorsey's classic calculation; Wilder (RMA) matches platforms that use Wilder smoothing.Options: EMA, Wilder (RMA) | EMA |
| Overbought LevelLevel above which the oscillator is considered overbought. | 80 |
| Oversold LevelLevel below which the oscillator is considered oversold. | 20 |
| Style | |
| RVI LineColor of the RVI line at the midline. Toward either threshold it blends into that threshold’s color. | #787b86 |
| OverboughtColor of the line and zone shading at and above the overbought level. | #089981 |
| OversoldColor of the line and zone shading at and below the oversold level. | #f23645 |
Alerts
You can alert on its line crossing a value or the candle close (from the chart's + menu); checked while ZoroCharts is open.
Notes and limits
- Works on any symbol and timeframe; it only needs candle data.
Education only. Not financial advice. Indicators mark what happened on the chart; they do not predict what price will do. Trading futures, forex, crypto and other markets carries a high level of risk and may not be suitable for everyone.