
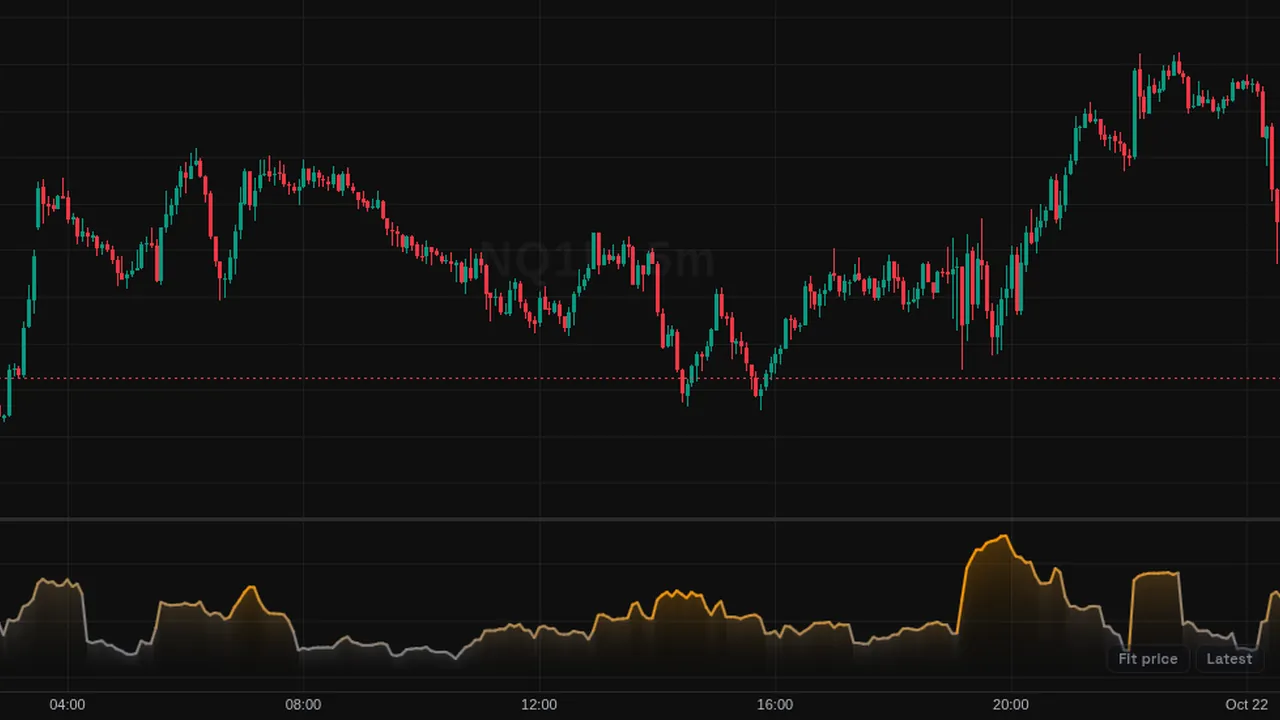
Historical volatility: the standard deviation of 10-bar log returns, scaled to a yearly figure with 252 periods by default.
Overview
Historical Volatility shows how much price has been moving, as a percentage, in its own pane. Higher readings mean bigger day-to-day changes.
By default it is annualized so values can be read as a yearly figure.
How it works
Log return = ln(close / previous close). HV = standard deviation of log returns over 10 bars x square root of periods per year x 100.
Use 252 for daily bars, 52 for weekly and 12 for monthly. Turn off Annualize to see per-bar volatility.
How to use it
- Use it to compare how volatile a symbol is now versus before.
- Some traders compare historical volatility with expected volatility from options.
- Watch for very low readings, which can come before larger moves.
- Use it to adjust position size.
These are ways some traders read it, for learning. They are not trade signals.
Settings
| Setting | Default |
|---|---|
| Settings | |
| LengthLookback window in bars for the standard deviation of close-to-close log returns. | 10 |
| AnnualizeScale the per-bar volatility to an annual figure by multiplying by the square root of the periods per year. | On |
| Periods Per YearNumber of periods in a year used for annualization: 252 for daily bars, 52 for weekly, 12 for monthly. | 252 |
| Style | |
| Volatility LineColor of the line at its recent highs; it fades toward grey as volatility contracts. | #ff9800 |
Alerts
You can alert on its line crossing a value or the candle close (from the chart's + menu); checked while ZoroCharts is open.
Notes and limits
- Works on any symbol and timeframe; it only needs candle data.
- On intraday charts set Periods Per Year to match the bar count, or turn off annualizing.
Education only. Not financial advice. Indicators mark what happened on the chart; they do not predict what price will do. Trading futures, forex, crypto and other markets carries a high level of risk and may not be suitable for everyone.