
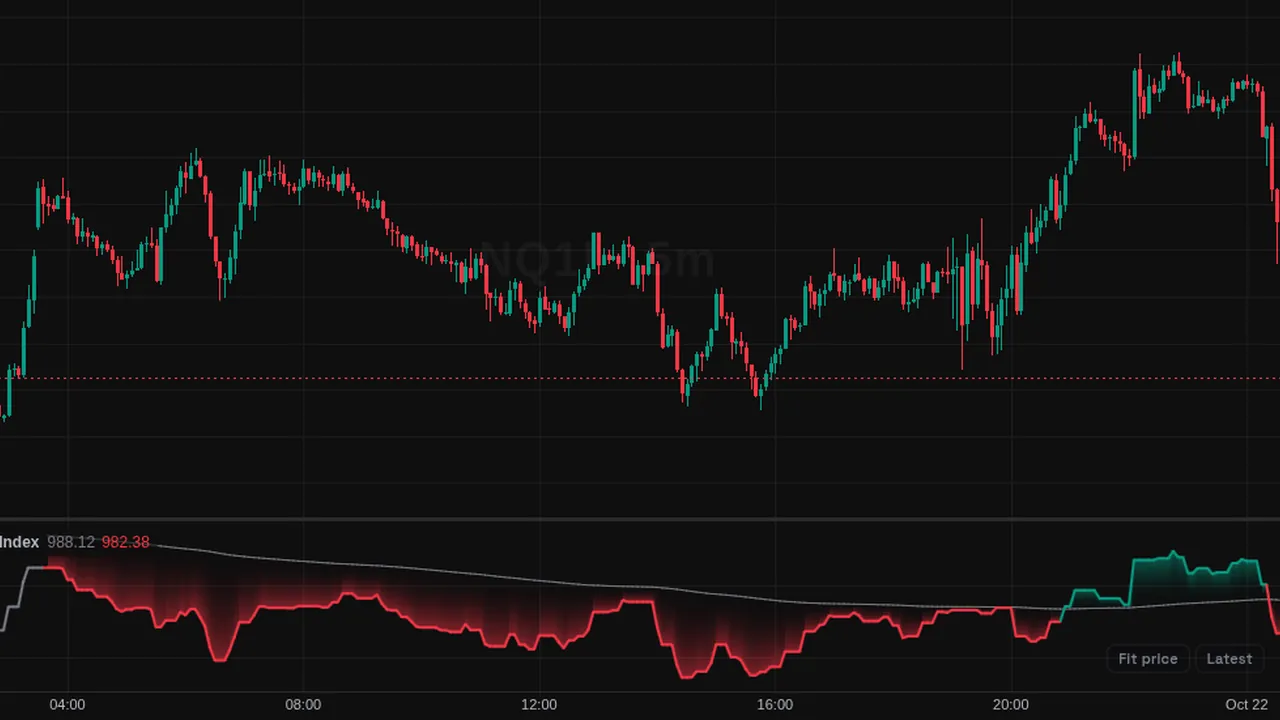
Positive Volume Index: a running line that moves only on bars with higher volume than the bar before, with a 255-bar EMA.
Overview
The Positive Volume Index (PVI) tracks price change only on days when volume rises. It plots in its own pane with a 255-bar signal EMA.
Colors show its position against the EMA, with a gradient fill.
How it works
Start at 1000. On a bar with higher volume than the previous one, PVI changes by the same percent as the source (close by default). On other bars it stays the same.
The signal is a 255-bar EMA, about one trading year on daily charts. The starting value has no meaning; read the slope and the position against the EMA.
How to use it
- Some traders read PVI above its EMA as a sign of a broad uptrend.
- Compare it with the Negative Volume Index.
- Use it on daily charts as designed.
- Watch the color change when PVI crosses its EMA.
These are ways some traders read it, for learning. They are not trade signals.
Settings
| Setting | Default |
|---|---|
| Settings | |
| SourcePrice series whose one-bar percentage change moves PVI on its active sessions.Options: Close, Open, High, Low, HL2, HLC3, OHLC4, HLCC4 | Close |
| Starting ValueSeed of the cumulative line. The absolute level carries no information, so the reads are the slope and the position against the signal EMA. | 1000 |
| Signal EMAPlots the long EMA of PVI that anchors the classic regime read. Hiding it keeps the regime coloring and fill, which are always measured against it. | On |
| Signal LengthLength of the signal EMA. The classic reference is 255 trading days on daily charts, about one year. | 255 |
| Style | |
| BullishColor of the line and gradient fill while it holds above its signal EMA. | #089981 |
| BearishColor of the line and gradient fill while it holds below its signal EMA. | #f23645 |
| NeutralColor used while the signal EMA is still forming, or the line sits exactly on it. | #787b86 |
| Signal LineColor of the signal EMA overlay. | #787b86 |
| Gradient FillFills the gap between the line and its signal EMA with a vertical gradient — transparent at the average, strongest at the line. | On |
Alerts
You can alert on its line crossing a value or the candle close (from the chart's + menu); checked while ZoroCharts is open.
Notes and limits
- It needs volume data; on symbols without volume it shows nothing useful.
- Made for daily charts; the 255-bar EMA needs a long history.
Education only. Not financial advice. Indicators mark what happened on the chart; they do not predict what price will do. Trading futures, forex, crypto and other markets carries a high level of risk and may not be suitable for everyone.