
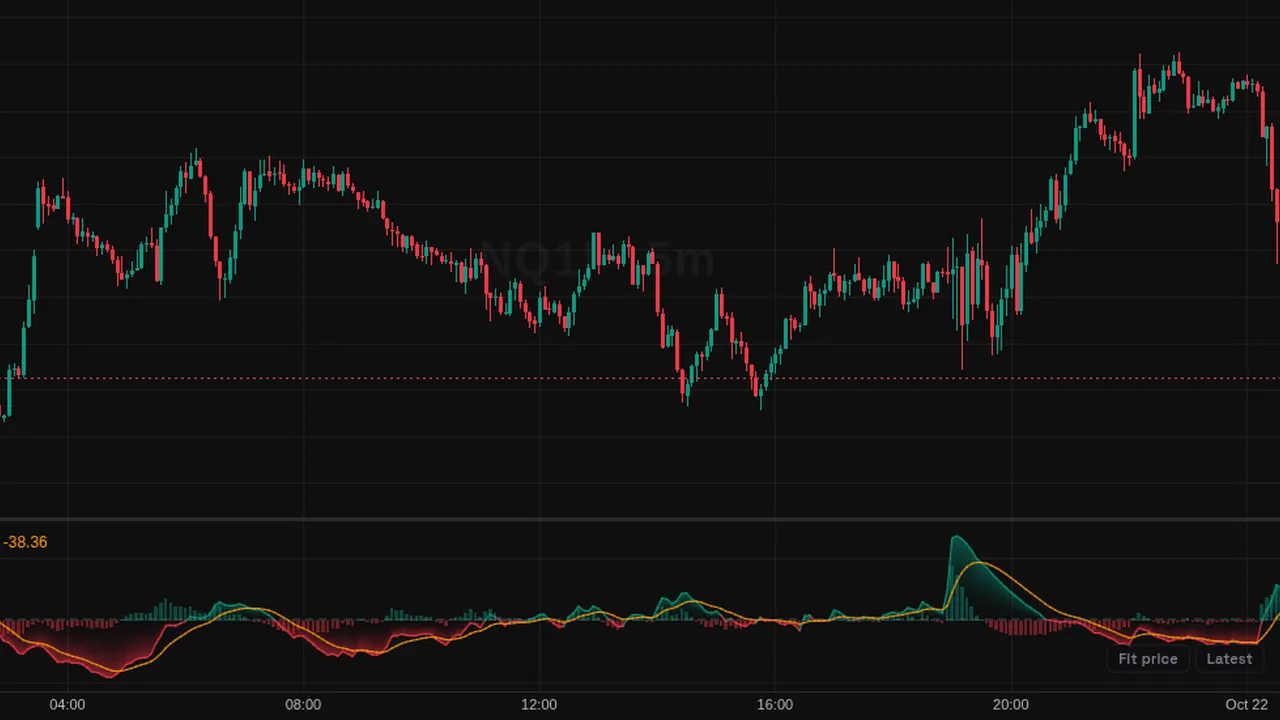
Percentage Volume Oscillator: the gap between a 12 and 26-bar EMA of volume as a percent, with signal and histogram.
Overview
The Percentage Volume Oscillator (PVO) works like a MACD on volume. It shows whether recent volume is above or below its longer average, in its own pane.
It has a signal line in orange and a histogram, with colors for expansion and contraction.
How it works
PVO = (EMA(volume, 12) - EMA(volume, 26)) / EMA(volume, 26) x 100. Signal = EMA(PVO, 9). Histogram = PVO - Signal.
Because it is a percent, it can be compared across symbols. The signal line and histogram can each be turned off.
How to use it
- Some traders watch PVO above zero as a sign of rising activity.
- Use it to check if a breakout comes with expanding volume.
- Watch PVO crossing its signal line for changes in volume trend.
- Use falling PVO in a trend as a sign of waning interest.
These are ways some traders read it, for learning. They are not trade signals.
Settings
| Setting | Default |
|---|---|
| Oscillator | |
| Fast LengthPeriod of the fast EMA of volume. The conventional setting is 12. | 12 |
| Slow LengthPeriod of the slow EMA of volume. The PVO expresses the fast/slow spread as a percentage of this slow average. | 26 |
| Signal LengthPeriod of the EMA applied to the PVO to form the signal line. | 9 |
| Style | |
| Expansion ColorColor of the oscillator and fill while participation expands. | #089981 |
| Contraction ColorColor of the oscillator and fill while participation contracts. | #f23645 |
| Signal LineColor of the signal line. | #ff9800 |
| Zero LineColor of the zero reference line. | #787b8680 |
| Show Signal LinePlot the signal line, an EMA of the PVO. | On |
| Show HistogramPlot the difference between the PVO and its signal line as columns behind the oscillator. | On |
Alerts
You can alert on its line crossing a value or the candle close (from the chart's + menu); checked while ZoroCharts is open.
Notes and limits
- It needs volume data; on symbols without volume it shows nothing useful.
Education only. Not financial advice. Indicators mark what happened on the chart; they do not predict what price will do. Trading futures, forex, crypto and other markets carries a high level of risk and may not be suitable for everyone.