
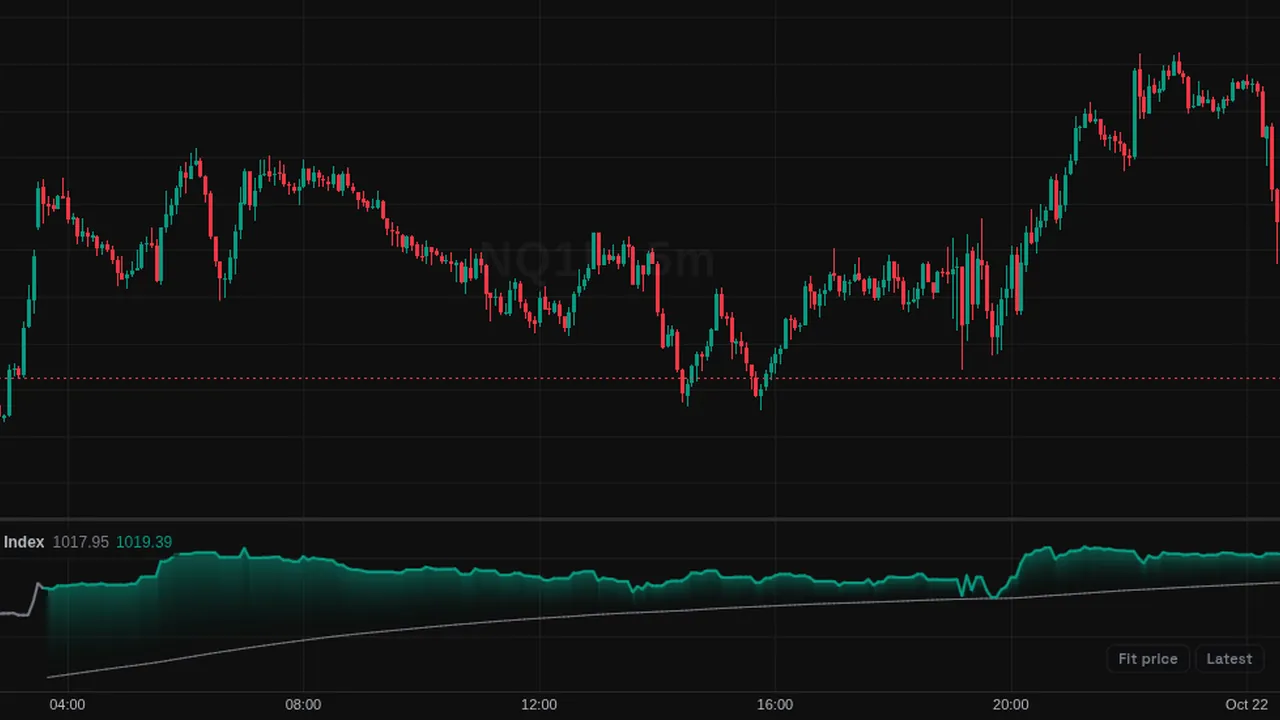
Negative Volume Index: a running line that moves only on bars with lower volume than the bar before, with a 255-bar EMA.
Overview
The Negative Volume Index (NVI) tracks price change only on days when volume falls. The idea is that quieter days show what informed traders are doing. It plots in its own pane with a 255-bar signal EMA.
By default the line is green above its EMA and red below, with a gradient fill.
How it works
Start at 1000. On a bar with lower volume than the previous one, NVI changes by the same percent as the close. On other bars it stays the same.
The signal is a 255-bar EMA, about one trading year on daily charts. The starting value has no meaning; read the slope and the position against the EMA.
How to use it
- Some traders read NVI above its EMA as a sign of a healthy trend.
- Use it on daily charts as it was designed.
- Compare it with the Positive Volume Index.
- Watch the color change when NVI crosses its EMA.
These are ways some traders read it, for learning. They are not trade signals.
Settings
| Setting | Default |
|---|---|
| Settings | |
| Starting ValueArbitrary seed of the cumulative line, conventionally 1000. The absolute level carries no information — the line is read by slope and by position against the signal EMA. | 1000 |
| Signal EMADisplays the conventional signal overlay. Hiding it only removes the plotted average; the regime coloring and fill still use it. | On |
| Signal LengthLength of the signal EMA. The convention is 255 sessions on daily charts, about one trading year. | 255 |
| Line ColoringPosition vs Average colors the line by the classic regime read; Single Color draws the whole line in the neutral color.Options: Position vs Average, Single Color | Position vs Average |
| Style | |
| BullishColor of the line and gradient fill while it holds above its signal EMA. | #089981 |
| BearishColor of the line and gradient fill while it holds below its signal EMA. | #f23645 |
| NeutralColor used while the signal EMA is still forming, or the line sits exactly on it. | #787b86 |
| Signal EMAColor of the signal EMA overlay. | #787b86 |
| Gradient FillFills the gap between the line and its signal EMA with a vertical gradient — transparent at the average, strongest at the line. | On |
Alerts
You can alert on its line crossing a value or the candle close (from the chart's + menu); checked while ZoroCharts is open.
Notes and limits
- It needs volume data; on symbols without volume it shows nothing useful.
- Made for daily charts; the 255-bar EMA needs a long history.
Education only. Not financial advice. Indicators mark what happened on the chart; they do not predict what price will do. Trading futures, forex, crypto and other markets carries a high level of risk and may not be suitable for everyone.