
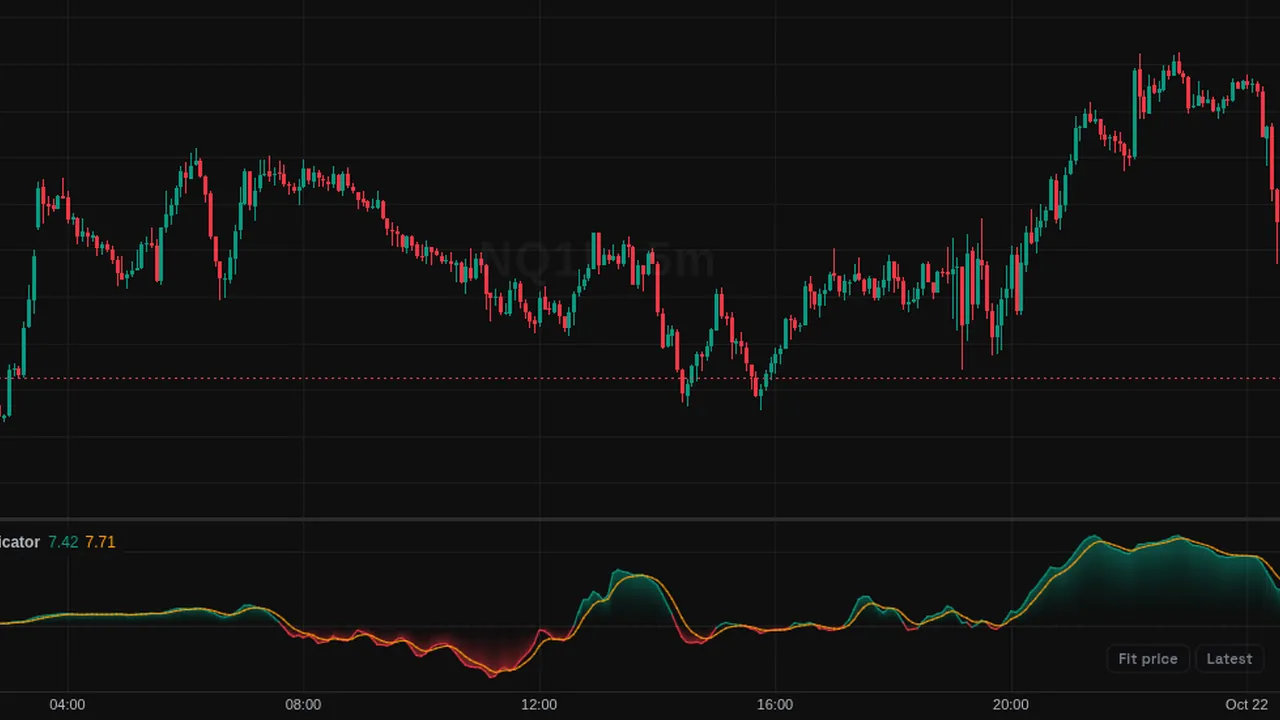
Volume Flow Indicator: signed volume over 130 bars with a volatility cutoff and volume cap, plus a signal line.
Overview
The Volume Flow Indicator (VFI), by Markos Katsanos, shows the balance of buying and selling volume in its own pane around zero. It has a signal line in orange and a gradient fill.
Above zero, volume on up moves has been heavier; below zero, on down moves.
How it works
For each bar, compare typical price with the previous bar. If the change is larger than a cutoff (0.2 x the 30-bar standard deviation of log changes x close), the volume is added as positive or negative. Each bar's volume is capped at 2.5 times average volume.
VFI = sum over 130 bars / average volume, then smoothed with a 3-bar EMA. Signal = 5-bar EMA.
How to use it
- Some traders watch VFI above zero as a sign of net buying volume.
- Use zero-line crosses as changes in volume flow.
- Look for divergence between VFI and price.
- Use it on daily charts as in its original design.
These are ways some traders read it, for learning. They are not trade signals.
Settings
| Setting | Default |
|---|---|
| Settings | |
| LengthRolling summation window, also used for the average volume that scales the result. The published default of 130 bars targets position-horizon work on daily charts. | 130 |
| Cutoff CoefficientScales the volatility-based minimum change in typical price. Moves smaller than the cutoff count as noise and contribute no volume. | 0.2 |
| Volume Cap MultiplierCaps each bar's volume contribution at this multiple of the average volume, so a single climactic print stays bounded. | 2.5 |
| Volatility LengthWindow of the standard deviation of the log change in typical price used to build the adaptive cutoff. | 30 |
| Smooth VFIApplies the published light smoothing — an EMA of the summed line — before plotting. | On |
| Smoothing LengthLength of the smoothing EMA. The published version uses 3 bars. | 3 |
| Signal LinePlots an EMA of VFI as a signal line. | On |
| Signal LengthLength of the signal-line EMA. | 5 |
| Style | |
| BullishColor of the VFI line and gradient fill above the zero line — the net accumulation regime. | #089981 |
| BearishColor of the VFI line and gradient fill below the zero line — the net distribution regime. | #f23645 |
| Signal LineColor of the signal line. | #ff9800 |
| Gradient FillFills the area between the zero line and the VFI line with a vertical gradient. | On |
Alerts
You can alert on its line crossing a value or the candle close (from the chart's + menu); checked while ZoroCharts is open.
Notes and limits
- It needs volume data; on symbols without volume it shows nothing useful.
- The 130-bar window makes it slow on purpose.
Education only. Not financial advice. Indicators mark what happened on the chart; they do not predict what price will do. Trading futures, forex, crypto and other markets carries a high level of risk and may not be suitable for everyone.