
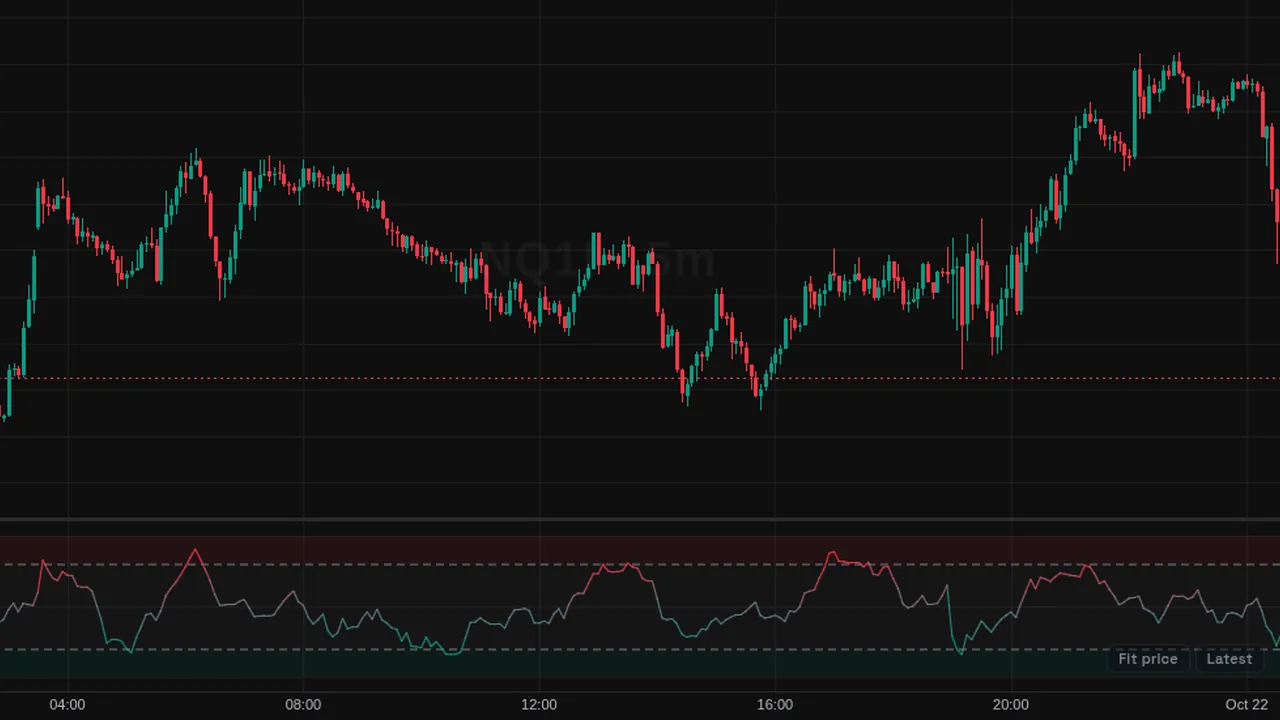
Money Flow Index: a volume-weighted RSI of typical price over 14 bars, with levels at 80 and 20.
Overview
The Money Flow Index (MFI) looks like RSI but includes volume. It runs from 0 to 100 in its own pane, with levels at 80 and 20 and a shaded zone between.
It is sometimes called volume-weighted RSI.
How it works
Typical price = (high + low + close) / 3. Raw money flow = typical price x volume. Over 14 bars, add money flow on bars where typical price rose (positive) and fell (negative). MFI = 100 - 100 / (1 + positive / negative).
Levels can be changed.
How to use it
- Some traders watch readings above 80 or below 20 as stretched.
- Look for divergence between MFI and price.
- Use crosses of 50 as changes in money flow direction.
- Compare with RSI to see if volume agrees with price momentum.
These are ways some traders read it, for learning. They are not trade signals.
Settings
| Setting | Default |
|---|---|
| Settings | |
| LengthNumber of bars used to sum positive and negative money flow. | 14 |
| Overbought LevelLevel above which the MFI is considered overbought. | 80 |
| Oversold LevelLevel below which the MFI is considered oversold. | 20 |
| Style | |
| MFIColor of the MFI line between the levels. Toward either level it blends into that level’s color. | #787b86 |
| OverboughtColor of the line and zone shading at and above the overbought level. | #f23645 |
| OversoldColor of the line and zone shading at and below the oversold level. | #089981 |
| OB/OS Zone FillFill color of the area between the overbought and oversold levels. | #787b860f |
Alerts
You can alert on its line crossing a value or the candle close (from the chart's + menu); checked while ZoroCharts is open.
Notes and limits
- It needs volume data; on symbols without volume it shows nothing useful.
Education only. Not financial advice. Indicators mark what happened on the chart; they do not predict what price will do. Trading futures, forex, crypto and other markets carries a high level of risk and may not be suitable for everyone.