
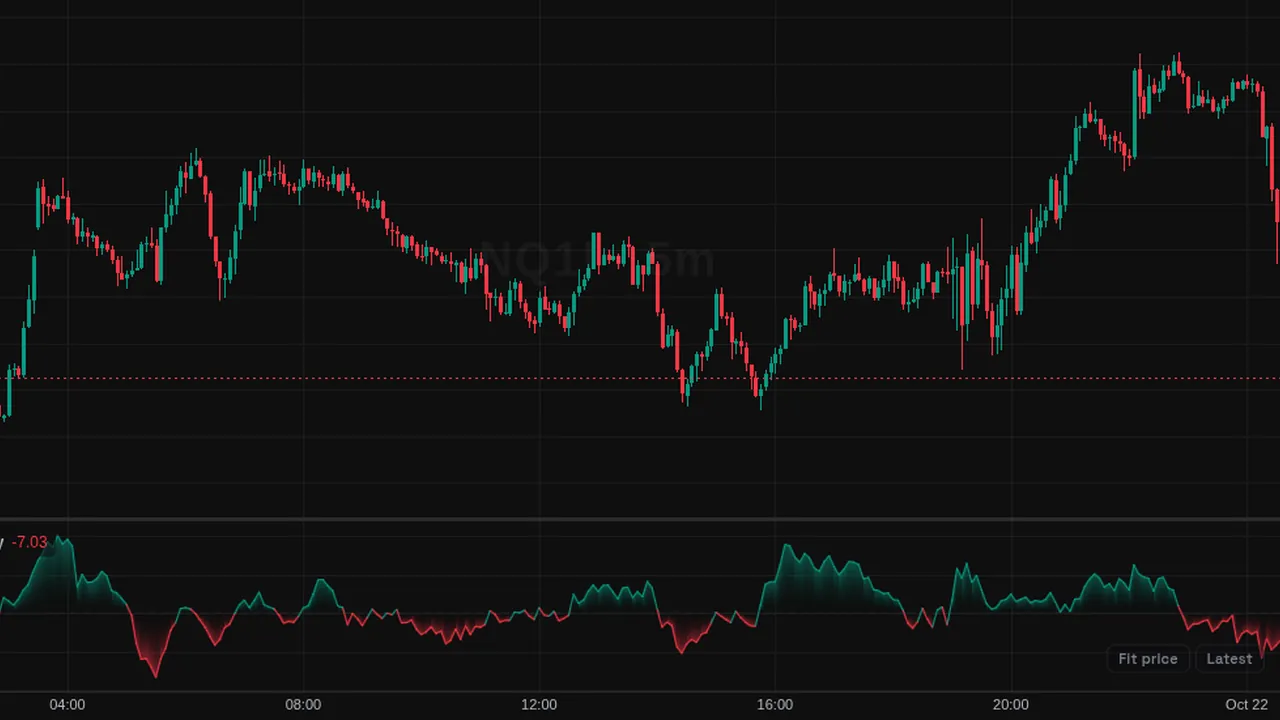
Intraday Intensity: volume weighted by where each bar closes in its range, as a 21-bar oscillator or a running line.
Overview
Intraday Intensity, by David Bostian, shows whether closes sit near highs or lows on volume. By default it is shown as a normalized oscillator (II%) around zero in its own pane.
You can switch to the cumulative line, which is read by its slope. Positive readings are green and negative ones red.
How it works
Intensity for one bar = (2 x close - high - low) / (high - low) x volume. II% = sum of intensity over 21 bars / sum of volume over 21 bars x 100.
The cumulative form is the running total of intensity; the length does not affect it.
How to use it
- Some traders watch II% staying positive as steady buying near highs.
- Use the cumulative line to compare its slope with price.
- Look for divergence between the line and price.
- Use zero crosses as changes in pressure.
These are ways some traders read it, for learning. They are not trade signals.
Settings
| Setting | Default |
|---|---|
| Settings | |
| DisplayThe two published forms. The cumulative line is open-ended and read by slope against price; the normalized oscillator divides a rolling sum of intensity by the rolling sum of volume and oscillates around zero.Options: Normalized Oscillator (II%), Cumulative Line | Normalized Oscillator (II%) |
| Oscillator LengthWindow of the rolling sums in the normalized form. The common setting is 21 bars. It has no effect on the cumulative line. | 21 |
| Style | |
| BullishColor of positive readings, the rising cumulative line and the fill above zero — the accumulation side. | #089981 |
| BearishColor of negative readings, the falling cumulative line and the fill below zero — the distribution side. | #f23645 |
| Gradient FillFills the area between the zero line and the oscillator with a vertical gradient. Applies to the normalized oscillator only. | On |
Alerts
You can alert on its line crossing a value or the candle close (from the chart's + menu); checked while ZoroCharts is open.
Notes and limits
- It needs volume data; on symbols without volume it shows nothing useful.
Education only. Not financial advice. Indicators mark what happened on the chart; they do not predict what price will do. Trading futures, forex, crypto and other markets carries a high level of risk and may not be suitable for everyone.