
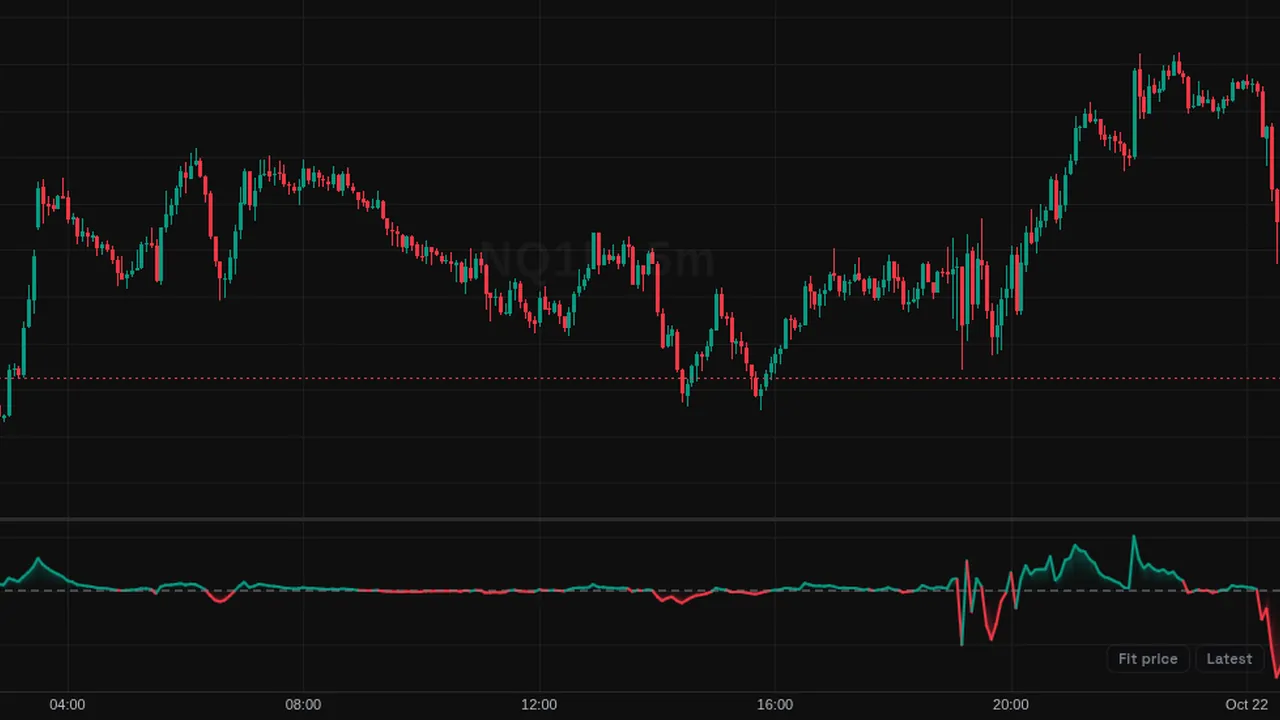
Force Index: the bar's price change times its volume, smoothed with a 13-bar EMA, around a zero line.
Overview
The Force Index, by Alexander Elder, combines price change and volume in its own pane. Above zero buyers had the upper hand; below zero sellers did.
Colors are green above zero and red below.
How it works
Raw force = (close - previous close) x volume. Force Index = EMA(raw force, 13).
Elder used 13 bars for the intermediate trend and 2 bars for short-term timing. Big moves on big volume give the largest readings.
How to use it
- Some traders watch zero-line crosses as changes in who is in control.
- Use a 2-bar setting to spot short dips inside a trend.
- Look for divergence between Force Index and price.
- Watch for spikes as signs of heavy, one-sided bars.
These are ways some traders read it, for learning. They are not trade signals.
Settings
| Setting | Default |
|---|---|
| Settings | |
| LengthEMA length applied to the raw 1-bar force index, (close − close[1]) × volume. Elder used 13 for the intermediate trend and 2 for short-term timing. | 13 |
| Style | |
| BullishColor of the line while above zero (buying pressure). | #089981 |
| BearishColor of the line while below zero (selling pressure). | #f23645 |
Alerts
You can alert on its line crossing a value or the candle close (from the chart's + menu); checked while ZoroCharts is open.
Notes and limits
- It needs volume data; on symbols without volume it shows nothing useful.
- Values depend on the symbol's volume, so they are not comparable across symbols.
- A 2-bar length is much noisier than the default.
Education only. Not financial advice. Indicators mark what happened on the chart; they do not predict what price will do. Trading futures, forex, crypto and other markets carries a high level of risk and may not be suitable for everyone.