
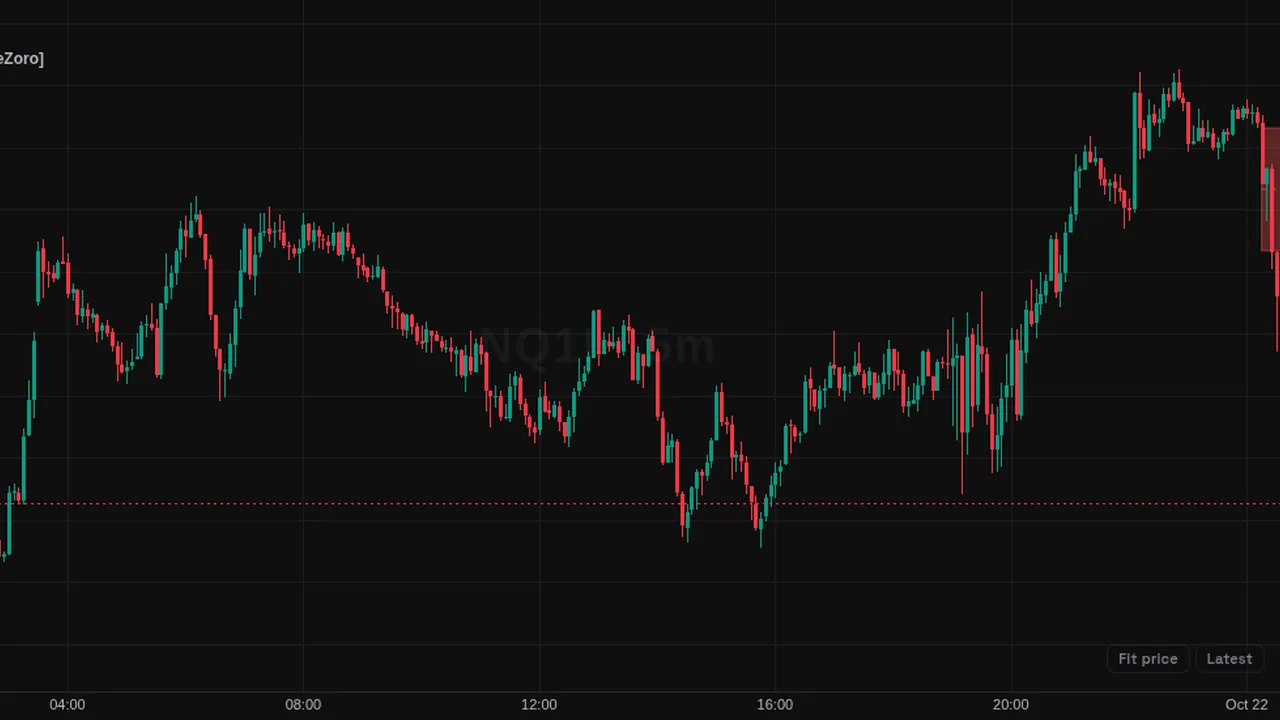
Draws higher-timeframe fair value gaps on your chart and chains each tapped and respected gap as Relay 1, 2, 3 until the chain breaks.
Overview
FVG Relay puts higher-timeframe fair value gaps on the chart you trade from. When price taps a gap and closes back in the gap's direction, that gap becomes Relay 1 and sets the trend. Each later gap that is tapped and respected adds to the chain as Relay 2, Relay 3 and so on.
Each relay draws a target line to the next resting liquidity level in its direction. A dashboard in the top right shows the timeframes, the trend, relays in the chain, open gaps, chains and the best chain, and targets reached.
How it works
Gaps come from 15m by default; 5m, 1h and 4h can be added, or all at once. Where a lower-timeframe gap overlaps a higher one, only the higher one is drawn. Higher-timeframe candles are built from completed chart bars with no lookahead. Up to 8 open gaps are drawn.
By default a bounce is confirmed when a bar closes back through the gap's near edge; you can switch to a close beyond the tap candle's extreme. The chain ends when a higher-timeframe candle closes through the far side of a relay gap, and the chart starts clean. Resting liquidity is read from 5m swings (strength 2) with 12 levels kept each side.
How to use it
- Some traders use the relay count to see how long a trend has kept respecting gaps.
- Use the target lines to see the next liquidity level in the trend direction.
- Some traders watch for the chain-broken event as a change in conditions.
- Use the dashboard to review chains and targets reached on the visible history.
These are ways some traders read it, for learning. They are not trade signals.
Settings
| Setting | Default |
|---|---|
| TradeZoro · Gap Timeframes | |
| Use every timeframe at onceOverrides the individual switches below. Where gaps overlap, only the highest timeframe gap is drawn. | Off |
| 5m | Off |
| 15m | On |
| 1h | Off |
| 4h | Off |
| Max open gaps drawn | 8 |
| Minimum gap size (ticks, 0 = off) | 0 |
| TradeZoro · FVG Style | |
| Bullish fill | color.new(#4CAF50, 86) |
| border | color.new(#4CAF50, 45) |
| active fill | color.new(#4CAF50, 66) |
Show all 36 settings
| Setting | Default |
|---|---|
| Bearish fill | color.new(#EF5350, 86) |
| border | color.new(#EF5350, 45) |
| active fill | color.new(#EF5350, 66) |
| Border width | 1 |
| styleOptions: Solid, Dashed, Dotted | Solid |
| Midline | On |
| TradeZoro · FVG Labels | |
| Timeframe label | On |
| bull | #4CAF50 |
| bear | #EF5350 |
| Label sizeOptions: Tiny, Small, Normal, Large | Tiny |
| Include the timeframe on relay labels | On |
| TradeZoro · Liquidity | |
| Show resting liquidity | On |
| StyleOptions: Solid, Dashed, Dotted | Dotted |
| Width | 1 |
| Swing timeframeLiquidity is read from swings on this timeframe, never from raw chart bars.Options: 5m, 15m, 1h, 4h | 5m |
| Swing strength (in those candles) | 2 |
| Levels kept each side | 12 |
| TradeZoro · Relay | |
| Bounce confirmationOptions: Close back through the near edge, Close beyond the tap candle's extreme | Close back through the near edge |
| Relay label | #FFFFFF |
| Target lineOptions: Solid, Dashed, Dotted | Dashed |
| Mark where a chain broke | Off |
| TradeZoro · Dashboard | |
| Dashboard | On |
| TradeZoro watermark | On |
| TradeZoro · Alerts | |
| Relay confirmed | On |
| Chain broken | On |
| Liquidity reached | Off |
Alerts
Members can create an alert on Relay confirmed, Chain broken or Liquidity hit from the chart's alert dialog; alerts from indicators run while ZoroCharts is open in the browser.
Notes and limits
- Gap timeframes must be above the chart timeframe.
- Gaps older than the current chain are removed.
- The dashboard counts what happened on the loaded history only.
Education only. Not financial advice. Indicators mark what happened on the chart; they do not predict what price will do. Trading futures, forex, crypto and other markets carries a high level of risk and may not be suitable for everyone.