
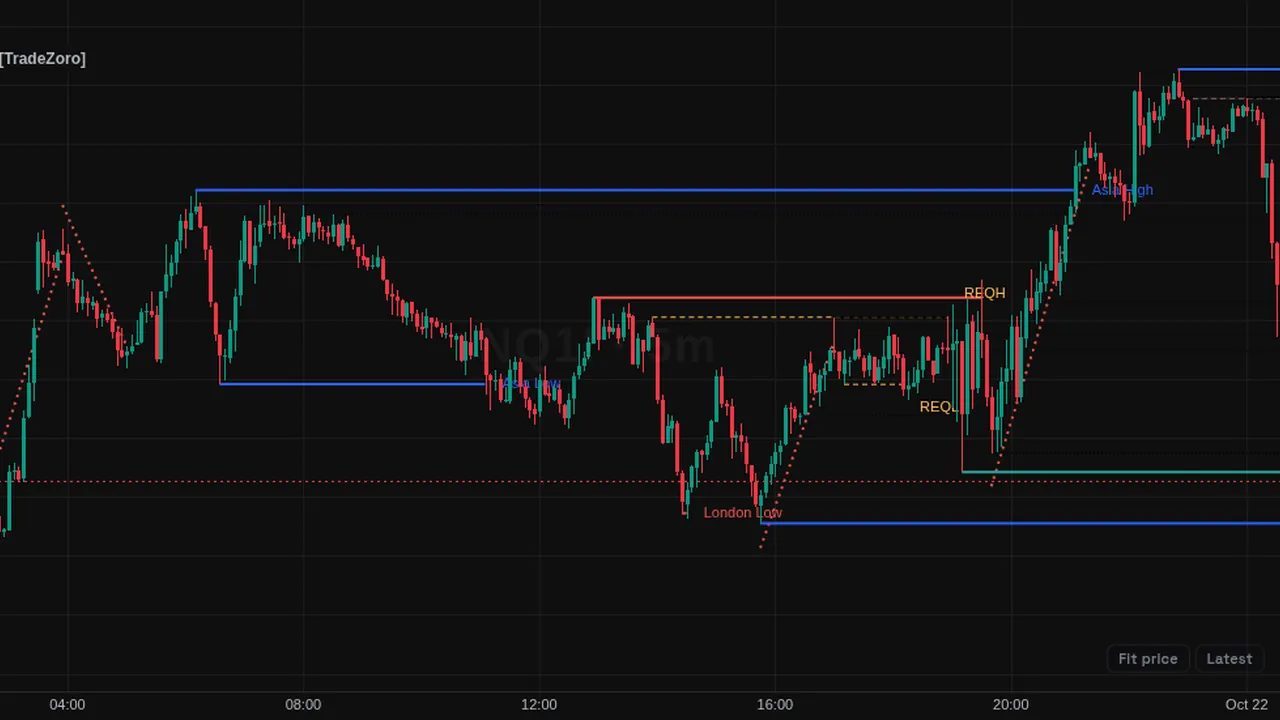
Draws session, previous day, week and month highs and lows, swing and candle liquidity per timeframe, HTF fair value gaps and REQH / REQL.
Overview
Liquidity Master gathers the places liquidity can rest onto one chart. It draws fair value gaps from the chart and higher timeframes, swing highs and lows per timeframe, completed candle highs and lows, Asia, London and New York session highs and lows, and previous day and week highs and lows (previous month is optional).
Two draw-on-liquidity tables list the nearest unswept major highs above price and lows below. It can also mark relative equal highs and lows (REQH and REQL), opening price lines (09:30 and 10:00 by default) and low-resistance legs.
How it works
Liquidity lines run from the bar that made them until the wick that takes them, then stop. Session and period lines also end at their natural expiry. Fair value gaps are removed when a candle closes through the far side, and where gaps overlap the highest timeframe wins. All higher-timeframe candles are built from chart bars, so each level is anchored to the bar that made it.
By default gaps show for the chart, 15m and 1h, swing liquidity for 5m, 15m and 1h, and candle liquidity for 1h and 4h, limited to the last 40 lines and to levels formed today and yesterday. The trading day starts at 18:00 New York time. Labels for levels close together are merged, for example NY Low and PDL, within 40% of ATR by default.
How to use it
- Some traders use the tables to see the nearest untaken highs and lows at a glance.
- Use the session lines to see which session's high or low has been swept.
- Some traders watch equal highs or lows as places stops may rest.
- Use the timeframe switches to keep only the levels you study.
These are ways some traders read it, for learning. They are not trade signals.
Settings
| Setting | Default |
|---|---|
| 0 · Liquidity Labels | |
| Merge labels when levels are withinOptions: Ticks, % of ATR | % of ATR |
| ticks | 4 |
| % ATRTwo liquidity levels this close together share one label, e.g. NY Low + PDL. ATR mode scales with the instrument and timeframe so labels that would visually overlap are combined. | 40 |
| 1 · Fair Value Gaps | |
| Chart | On |
| 5m | Off |
| 10m | Off |
| 15m | On |
| 30m | Off |
| 1h | On |
| 4h | Off |
Show all 143 settings
| Setting | Default |
|---|---|
| D | Off |
| W | Off |
| Highest timeframe wins where gaps overlap | On |
| Gaps kept on chart (0 = unlimited) | 0 |
| Bullish fill | color.new(#26A69A, 86) |
| border | color.new(#26A69A, 60) |
| Bearish fill | color.new(#EF5350, 86) |
| border | color.new(#EF5350, 60) |
| Border width | 0 |
| Midline | On |
| Label | On |
| Bullish labelOptions: Upper left, Upper right, Middle left, Middle right, Lower left, Lower right, Center | Middle right |
| Bearish labelOptions: Upper left, Upper right, Middle left, Middle right, Lower left, Lower right, Center | Middle right |
| 0 · Liquidity Labels | |
| Show last N liquidity lines (0 = all)Caps swing and candle liquidity lines across all timeframes to the most recent N, including swept ones still on the chart. Sessions and previous periods are not counted. | 40 |
| Show levels & gaps formedApplies to every drawing: gaps, swing and candle liquidity, sessions, previous periods, structure. Days roll at the trading-day start set under Sessions.Options: Today, Today + yesterday, Last N days, All | Today + yesterday |
| N | 5 |
| 2 · Swing Liquidity | |
| 5m | On |
| 10m | Off |
| 15m | On |
| 30m | Off |
| 1h | On |
| 4h | Off |
| D | Off |
| W | Off |
| High | #000000 |
| Low | #000000 |
| StyleOptions: Solid, Dashed, Dotted | Solid |
| Width | 1 |
| Label | Off |
| Label positionOptions: Left, Center, Right | Right |
| Levels kept per timeframe & side (0 = unlimited) | 0 |
| 3 · Candle Liquidity | |
| 5m | Off |
| 10m | Off |
| 15m | Off |
| 30m | Off |
| 1h | On |
| 4h | On |
| D | Off |
| W | Off |
| High | #000000 |
| Low | #000000 |
| StyleOptions: Solid, Dashed, Dotted | Dotted |
| Width | 1 |
| Label | Off |
| Label positionOptions: Left, Center, Right | Right |
| Candles kept per timeframe (0 = unlimited) | 0 |
| 4 · Sessions | |
| TimezoneOptions: America/New_York, America/Chicago, Europe/London, Asia/Tokyo, UTC | America/New_York |
| Trading day starts at (HHMM)Futures day rolls at 18:00 ET. This boundary decides what counts as today / yesterday for gaps, and when session lines expire. | 1800 |
| 4a · Asia | |
| Enabled | On |
| High | #2962FF |
| Low | #2962FF |
| StyleOptions: Solid, Dashed, Dotted | Solid |
| Width | 2 |
| Label | On |
| Label positionOptions: Left, Center, Right | Right |
| 4b · London | |
| Enabled | On |
| High | #EF5350 |
| Low | #EF5350 |
| StyleOptions: Solid, Dashed, Dotted | Solid |
| Width | 2 |
| Label | On |
| Label positionOptions: Left, Center, Right | Right |
| 4c · New York | |
| Enabled | On |
| High | #26A69A |
| Low | #26A69A |
| StyleOptions: Solid, Dashed, Dotted | Solid |
| Width | 2 |
| Label | On |
| Label positionOptions: Left, Center, Right | Right |
| 5 · Previous Day | |
| Enabled | On |
| High | #2962FF |
| Low | #2962FF |
| StyleOptions: Solid, Dashed, Dotted | Solid |
| Width | 2 |
| Label | On |
| Label positionOptions: Left, Center, Right | Right |
| 6 · Previous Week | |
| Enabled | On |
| High | #2962FF |
| Low | #2962FF |
| StyleOptions: Solid, Dashed, Dotted | Solid |
| Width | 2 |
| Label | On |
| Label positionOptions: Left, Center, Right | Right |
| 7 · Previous Month | |
| Enabled | Off |
| High | #2962FF |
| Low | #2962FF |
| StyleOptions: Solid, Dashed, Dotted | Solid |
| Width | 2 |
| Label | On |
| Label positionOptions: Left, Center, Right | Right |
| 8 · Draw on Liquidity | |
| Show draw-on-liquidity tablesTop right: the major highs above price (sessions, PDH, PWH, PMH). Bottom right: the major lows below. Nearest first, unswept only. | On |
| Rows per table | 6 |
| Text sizeOptions: Tiny, Small, Normal, Large | Small |
| Highs | #EF5350 |
| Lows | #26A69A |
| Background | color.new(#131722, 10) |
| Frame | color.new(#787B86, 40) |
| Text | #D1D4DC |
| 8a · Opening Prices | |
| Show opening prices | On |
| Time 1 | 0930 |
| Time 2 | 1000 |
| Time 3 | None |
| Time 4 | None |
| Time 5 | None |
| Colour | #000000 |
| StyleOptions: Solid, Dashed, Dotted | Dotted |
| Width | 1 |
| Label | On |
| Label positionOptions: Left, Center, Right | Right |
| Line runs untilOptions: Trading day end, Swept, Whichever first | Trading day end |
| 9 · Structure (chart timeframe) | |
| Swing strength (bars either side) | 3 |
| Relative equal highs / lows | On |
| tolerance (ticks) | 4 |
| REQH / REQL label | On |
| Low resistance liquidity legsA smooth, one-directional leg between two major swings — few pullbacks, few gaps — is low resistance: price moved through that range without leaving anything to defend. Marked with a curve alongside the leg. | On |
| Major swing strength | 5 |
| min bars | 12 |
| Min leg size (× ATR) | 2.5 |
| min efficiencyEfficiency = net move ÷ total path travelled. 1.0 is a straight line. Lower it to accept slightly choppier legs. | 0.55 |
| Max pullback (% of leg) | 30 |
| StyleOptions: Solid, Dashed, Dotted | Dotted |
| Width | 2 |
| Offset from price (× ATR) | 0.8 |
| Legs kept | 6 |
| LRLR label | Off |
| News wicks at swingsMarks swing wicks that printed inside the window around a USD release. Pine has no economic calendar, so enter today's release times below (New York time, HHMM, comma-separated). | Off |
| USD release times (HHMM) | 0830, 1000, 1400 |
| Window after release (minutes) | 15 |
| Min wick × ATR | 0.3 |
| min % of candle | 40 |
| Label sizeOptions: Tiny, Small, Normal, Large | Small |
| 10 · Display | |
| Watermark | On |
| Watermark colour | color.new(#B2B5BE, 35) |
Notes and limits
- It draws many objects; turning off timeframes you do not need keeps the chart readable.
- Higher timeframes are built from the loaded chart bars, so a short history limits them.
- The script has no alert conditions.
Education only. Not financial advice. Indicators mark what happened on the chart; they do not predict what price will do. Trading futures, forex, crypto and other markets carries a high level of risk and may not be suitable for everyone.