
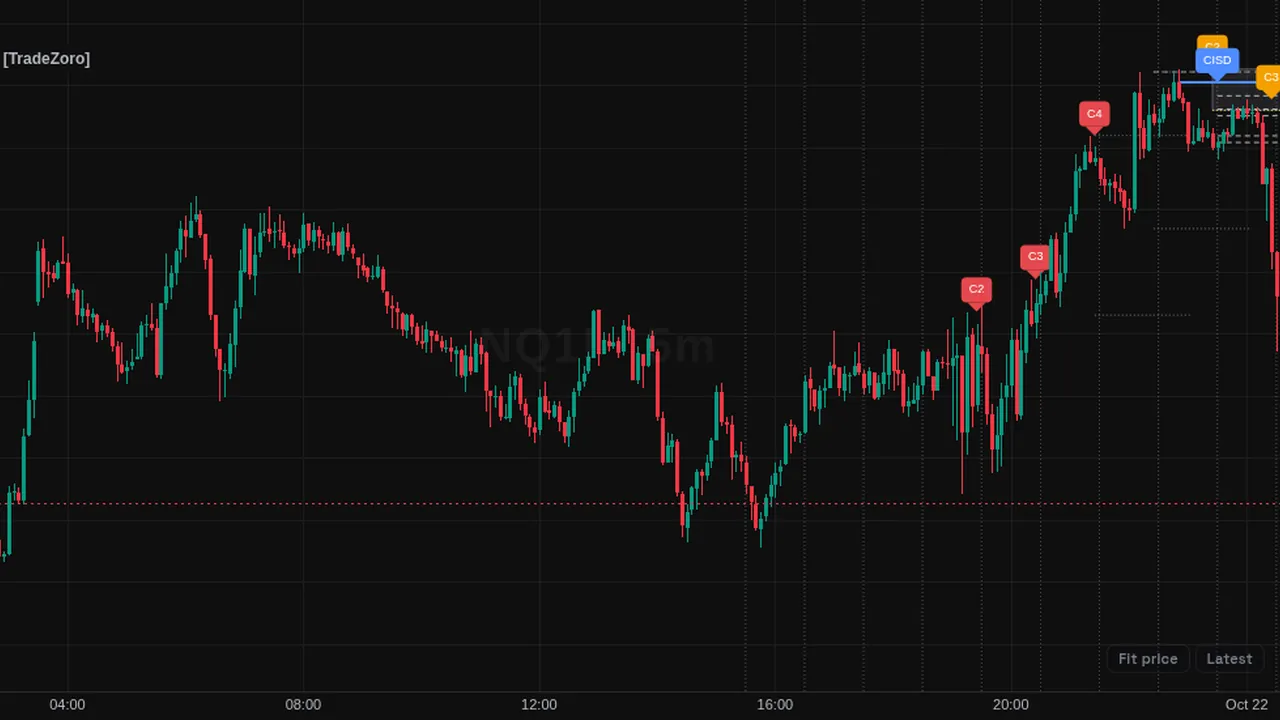
Marks a higher-timeframe candle that sweeps the prior candle's high or low and closes back, then CISD confirmation, projections and right-side candles.
Overview
TZ Fractal Model pairs a lower and a higher timeframe and looks for one pattern. A higher-timeframe candle (C2) trades beyond the prior candle's (C1) low or high and closes back inside it. The model then waits for a change in state of delivery (CISD) on the chart: a close back through the open of the run of candles that made the extreme.
When confirmed, it draws the CISD line, projection lines, the C2 midpoint (EQ), a T-spot box, the C1 liquidity ray and nearby formation liquidity. C2, C3 and C4 labels mark the candles; they turn red if the setup fails. Higher-timeframe candles are also drawn to the right of the last bar, with an info table.
How it works
Pairing is automatic from the chart timeframe (for example 5m with 1H) or set by hand: 1m-15m, 3m-30m, 5m-1H, 15m-4H, 1H-1D or 4H-1W. Higher-timeframe candles are built from chart bars with no lookahead.
A setup fails if price returns beyond the C2 extreme. If confirmation comes after the next higher-timeframe candle, the labels show in the no-fail colour. Projections are multiples of the leg from the C2 extreme to the CISD level: 1, 2, 2.5, 4 and 4.5 by default. The info table shows the model name, a countdown to the higher-timeframe close, the bias and whether the time filter is on. Up to three New York time windows can limit where setups form.
How to use it
- Some traders use it to study higher-timeframe sweeps from a lower-timeframe chart.
- Use the CISD line to see where the lower timeframe changed direction.
- Some traders use the projection lines as reference levels for the move.
- Use the history setting to review recent setups that held or failed.
These are ways some traders read it, for learning. They are not trade signals.
Settings
| Setting | Default |
|---|---|
| TradeZoro · Pairing | |
| Timeframe pairingOptions: Automatic, 1m-15m, 3m-30m, 5m-1H, 15m-4H, 1H-1D, 4H-1W | Automatic |
| TradeZoro · Model | |
| BiasOptions: Neutral, Bullish, Bearish | Neutral |
| History setups | 3 |
| Projection listComma-separated leg multiples. Negative values project in the setup direction. | -1, -2, -2.5, -4, -4.5 |
| TradeZoro · Time Windows (New York) | |
| Window 1 | Off |
| Window 2 | Off |
| Window 3 | Off |
| TradeZoro · Elements | |
| HTF candles | On |
Show all 34 settings
| Setting | Default |
|---|---|
| HTF open dotted lines | On |
| C2/C3/C4 labels | On |
| CISD line | On |
| Projections | On |
| HTF EQ line | On |
| T-spot box | On |
| C1 liquidity ray | On |
| Formation liquidity | On |
| Info table | On |
| TradeZoro · HTF Candles | |
| Candles shown | 4 |
| Distance from last bar | 4 |
| Candle half-width | 2 |
| Candle gap | 1 |
| TradeZoro · Colours | |
| Bull body | #26A69A |
| Bear body | #2D313B |
| Wick | #B2B5BE |
| CISD | #4F8CFF |
| Projections | #B2B5BE |
| EQ | #F5C542 |
| T-spot | color.new(#787B86, 82) |
| Liquidity | #8B93A0 |
| Valid label | #787B86 |
| Failed label | #E5484D |
| No-fail label | #F59F00 |
| TradeZoro · Table | |
| PositionOptions: Top left, Top center, Top right, Middle right, Bottom left, Bottom center, Bottom right | Bottom right |
| SizeOptions: Tiny, Small, Normal, Large | Small |
Notes and limits
- If the chart timeframe is above the pair's lower timeframe, only the higher-timeframe candles are drawn.
- The bias setting limits setups to one direction.
- The script has no alert conditions.
Education only. Not financial advice. Indicators mark what happened on the chart; they do not predict what price will do. Trading futures, forex, crypto and other markets carries a high level of risk and may not be suitable for everyone.