
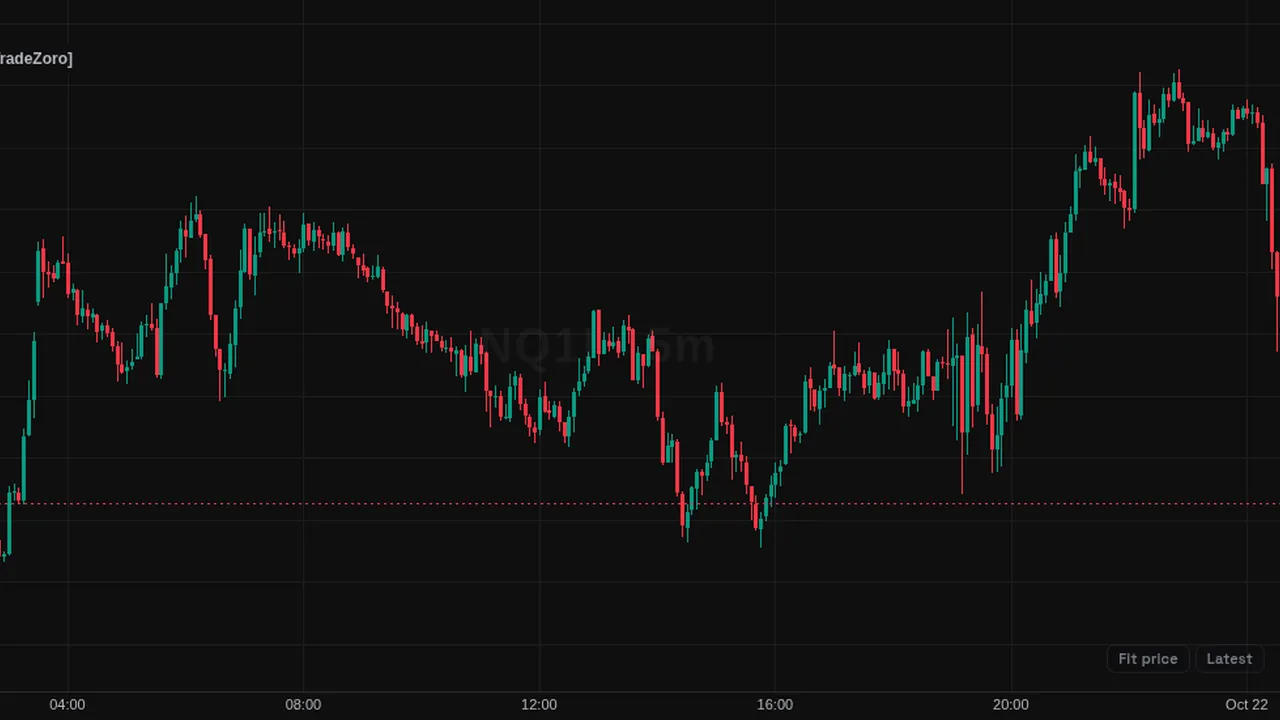
Draws candles from up to five higher timeframes to the right of the last bar, with their fair value gaps, sweeps and a countdown to each close.
Overview
HTF PO3 Lens lets you read higher-timeframe candles without leaving your chart. To the right of the last bar it draws a stack of candles for each chosen timeframe, lined up with the chart's price scale. By default it shows two candles each for 15m, 1h and 4h; daily and weekly can be switched on.
Each stack carries its timeframe name and a countdown to the candle close. Fair value gaps between the stacked candles are shaded, and sweeps of a prior candle's high or low are marked with a short line across the wick that took it.
How it works
The higher-timeframe candles are built from completed chart bars, with no lookahead. You set how many candles per timeframe (1 to 6), the distance from the last bar, the candle width and the gaps between candles and stacks.
A fair value gap is the space left between candles in the stack, and it can be extended to the end of the stack. Sweeps shown per stack default to the most recent one. Optional extras add BSL or SSL text beside the sweep marker and extend swept levels back across the chart as dashed lines. A price line runs across the panel at the current price.
How to use it
- Some traders read the open, high, low and close of the higher-timeframe candle to frame the session (the Power of Three idea).
- Use the countdown to see how much time is left in each higher-timeframe candle.
- Some traders watch whether price is trading into a higher-timeframe gap.
- Use the sweep marks to see which candle highs or lows were taken.
These are ways some traders read it, for learning. They are not trade signals.
Settings
| Setting | Default |
|---|---|
| TradeZoro · Timeframes | |
| Candles per timeframe | 2 |
| TradeZoro · Layout | |
| Distance from last bar (bars) | 15 |
| Candle half-width (bars) | 2 |
| Gap between candles (bars) | 1 |
| Gap between timeframes (bars) | 3 |
| Current price line across the panel | On |
| TradeZoro · Candles | |
| Bull body | #26A69A |
| border | #1B5E20 |
| wick | #26A69A |
Show all 27 settings
| Setting | Default |
|---|---|
| Bear body | #434651 |
| border | #131722 |
| wick | #434651 |
| Border width | 1 |
| Timeframe text | #787B86 |
| Countdown to close | On |
| TradeZoro · Fair Value Gaps | |
| Show HTF fair value gaps | On |
| Bullish | color.new(#26A69A, 78) |
| Bearish | color.new(#EF5350, 78) |
| Extend gap to the end of the stack | On |
| TradeZoro · Sweeps | |
| Mark sweeps on the HTF candlesA short line at the swept level, from the candle that set it across the wick that took it. | On |
| Sweeps shown per stack (most recent first)Capped by the number of candles in the stack — there can never be more sweeps than candles. | 1 |
| Marker | #131722 |
| BSL / SSL text beside the marker | Off |
| Liquidity lines across the chartExtends each swept level as a dashed line back over the latest candles and out to the stack. | Off |
| Extend back (bars) | 40 |
| TradeZoro · Other | |
| Watermark | On |
| Watermark colour | color.new(#B2B5BE, 35) |
Notes and limits
- The chosen timeframes should be above the chart timeframe.
- The stack sits in the space right of the last bar, so leave room on the chart.
- The script has no alert conditions.
Education only. Not financial advice. Indicators mark what happened on the chart; they do not predict what price will do. Trading futures, forex, crypto and other markets carries a high level of risk and may not be suitable for everyone.