
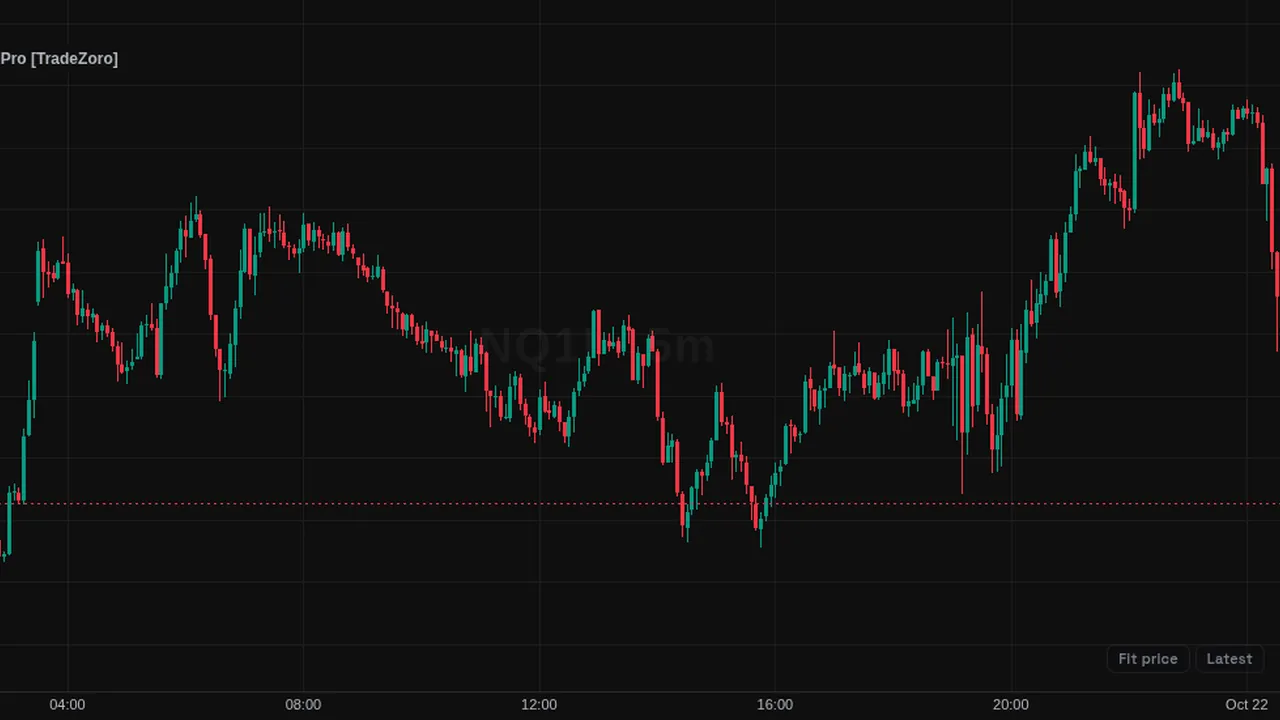
Joins two swing points with a line where one correlated futures market makes a new swing and the other fails to, on several timeframes.
Overview
SMT Divergence Pro compares your chart with a correlated instrument. When one makes a new swing high or low and the other does not, the two swing points are joined by a line, with a small up or down marker at the divergence. Bullish SMT is read from swing lows and bearish SMT from swing highs.
It runs on the chart timeframe plus up to three higher timeframes, each with its own pivot strength, colours and number of past SMTs kept (20 by default). A watermark lists the symbols and timeframes in use.
How it works
With auto-pair on, NQ is compared with ES, ES with NQ, and YM and RTY with ES. With it off you can set up to three comparison symbols yourself. Swings are found on both symbols independently, so a divergence is caught whichever instrument prints the pivot. Pivot strength Weak, Medium and Strong mean 2, 5 and 10 candles either side, or a custom number.
Higher-timeframe candles are built from the chart's own bars, so each line is anchored to the exact chart bar that made the swing. While a swing is still forming, a provisional dotted line can be drawn and is then replaced on confirmation or removed if the pivot fails. When price later trades through the divergence swing, the SMT is removed by default, or kept dimmed. An optional session filter limits detection to set time windows.
How to use it
- Some traders look for SMT near a session high or low as a sign one market is not confirming the other.
- Use the higher-timeframe lines to see divergences that the chart timeframe alone would miss.
- Some traders combine it with liquidity sweeps or fair value gaps from other tools.
- Use the session filter to study only the hours you trade.
These are ways some traders read it, for learning. They are not trade signals.
Settings
| Setting | Default |
|---|---|
| TradeZoro · Comparison Symbols | |
| Auto-pair from the chart symbolNQ pairs with ES, ES with NQ, YM and RTY with ES. Manual symbols below are used when this is off. | On |
| Symbol 1 | ES1! |
| Symbol 2 | YM1! |
| Symbol 3 | RTY1! |
| TradeZoro · Detection | |
| DirectionOptions: Both, Bullish, Bearish | Both |
| Which symbol must fail to make the new swingOptions: Either, Chart symbol, Comparison symbol | Either |
| Single SMT per pivotOnce a swing has produced an SMT, it is not reused. | On |
| Real-time detectionA provisional dotted line is drawn while the swing is still forming, on every timeframe. It is replaced by the confirmed line, or removed if the pivot fails to confirm. | On |
| When price trades through the divergence swingOptions: Remove, Keep, dimmed, Keep as is | Remove |
| TradeZoro · Timeframe 1 (chart) | |
Show all 39 settings
| Setting | Default |
|---|---|
| Enabled | On |
| Pivot strengthOptions: Weak, Medium, Strong, Custom | Weak |
| Bullish | #26A69A |
| Bearish | #EF5350 |
| Historical SMTs kept | 20 |
| TradeZoro · Timeframe 2 | |
| Auto (next above chart) | On |
| Pivot strengthOptions: Weak, Medium, Strong, Custom | Weak |
| Bullish | #00897B |
| Bearish | #C62828 |
| Historical SMTs kept | 20 |
| TradeZoro · Timeframe 3 | |
| Auto (two above chart) | On |
| Pivot strengthOptions: Weak, Medium, Strong, Custom | Weak |
| Bullish | #004D40 |
| Bearish | #7F0000 |
| Historical SMTs kept | 20 |
| TradeZoro · Timeframe 4 | |
| Auto (three above chart) | On |
| Pivot strengthOptions: Weak, Medium, Strong, Custom | Weak |
| Bullish | #1B5E20 |
| Bearish | #B71C1C |
| Historical SMTs kept | 20 |
| TradeZoro · Session Filter | |
| Session filter | Off |
| Window 1 | 0930-1200 |
| Window 2 | 1330-1545 |
| Use window 2 | Off |
| TimezoneOptions: America/New_York, America/Chicago, Europe/London, Asia/Tokyo, UTC | America/New_York |
| TradeZoro · Display | |
| ▲ / ▼ marker at the divergence | On |
| Text (symbol · timeframe) | Off |
| SizeOptions: Tiny, Small, Normal, Large | Small |
| Watermark | On |
| Watermark colour | color.new(#B2B5BE, 35) |
Alerts
Members can create an alert on Bullish SMT, Bearish SMT or Any SMT from the chart's alert dialog; alerts from indicators run while ZoroCharts is open in the browser.
Notes and limits
- Needs data for the comparison symbol on the same timeframe.
- Higher timeframes must be above the chart timeframe.
- A divergence is a comparison of swings, not a signal on its own.
Education only. Not financial advice. Indicators mark what happened on the chart; they do not predict what price will do. Trading futures, forex, crypto and other markets carries a high level of risk and may not be suitable for everyone.