
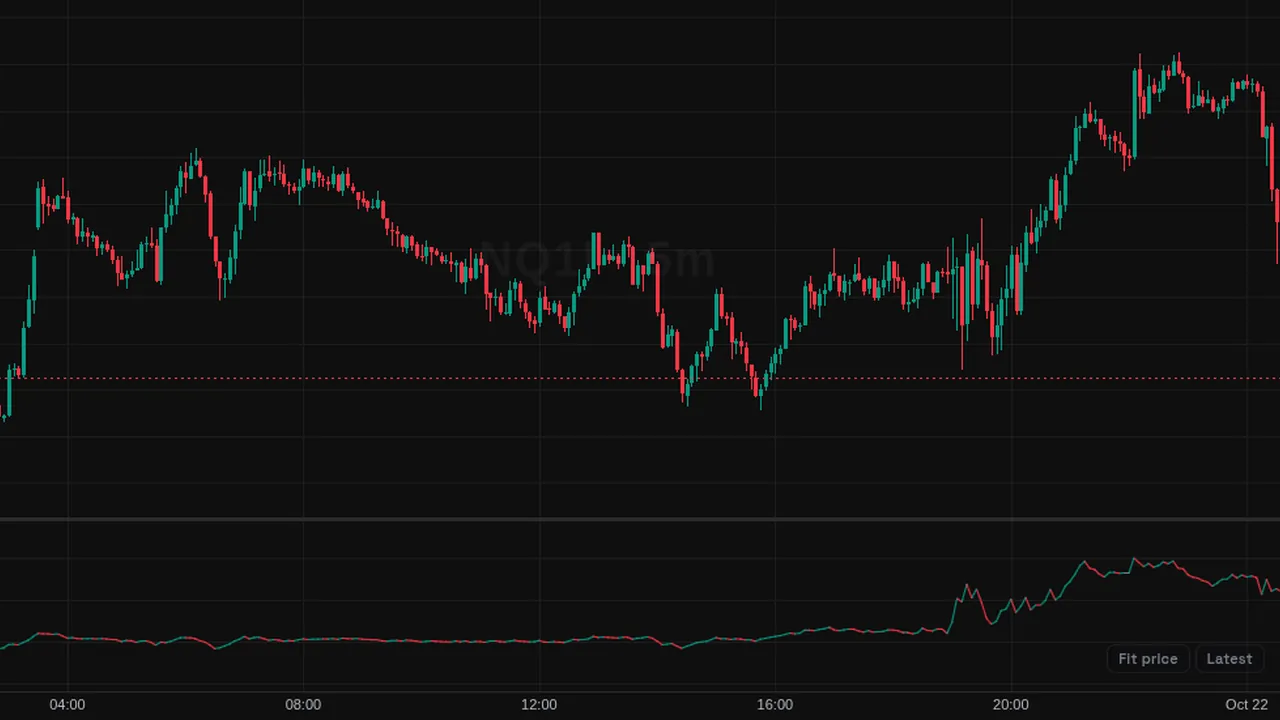
Accumulation/Distribution line: a running total of volume weighted by where each bar closes in its range.
Overview
The Accumulation/Distribution (A/D) line adds up volume, weighted by where each candle closes, in its own pane. It rises when closes sit near highs on good volume and falls when they sit near lows.
With slope coloring on, it is green while rising and red while falling.
How it works
Money flow multiplier = ((close - low) - (high - close)) / (high - low). Money flow volume = multiplier x volume. A/D = running total of money flow volume.
The level itself has no meaning; the slope and direction are what count.
How to use it
- Some traders watch for divergence between A/D and price.
- Use a rising line during a range as a sign of accumulation.
- Use a falling line during a rally as a sign of weaker support.
- Compare it with OBV to see two views of volume flow.
These are ways some traders read it, for learning. They are not trade signals.
Settings
| Setting | Default |
|---|---|
| Style | |
| Slope ColoringColor the line by its slope — bullish while rising (accumulation), bearish while falling (distribution). | On |
| A/D LineColor of the line when slope coloring is disabled or the line is flat. | #787b86 |
| RisingLine color while the A/D Line rises. | #089981 |
| FallingLine color while the A/D Line falls. | #f23645 |
Alerts
You can alert on its line crossing a value or the candle close (from the chart's + menu); checked while ZoroCharts is open.
Notes and limits
- It needs volume data; on symbols without volume it shows nothing useful.
- It ignores gaps between bars.
Education only. Not financial advice. Indicators mark what happened on the chart; they do not predict what price will do. Trading futures, forex, crypto and other markets carries a high level of risk and may not be suitable for everyone.