
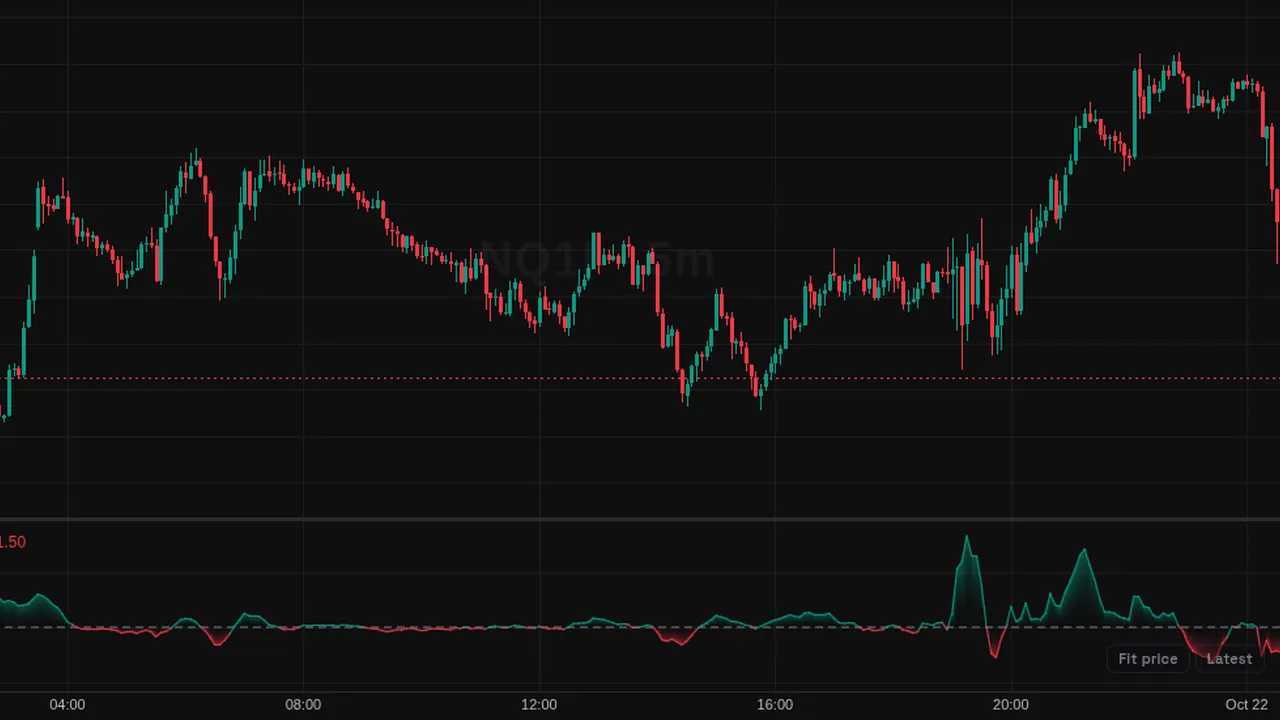
Chaikin Oscillator: the 3-bar EMA minus the 10-bar EMA of the Accumulation/Distribution line, around zero.
Overview
The Chaikin Oscillator shows the momentum of the Accumulation/Distribution line, in its own pane around zero.
The line and fill are green above zero (accumulation) and red below (distribution).
How it works
Chaikin Oscillator = EMA(A/D, 3) - EMA(A/D, 10). The A/D line is the running total of volume weighted by where each bar closes in its range.
Both EMA lengths can be changed. Because it uses the A/D line, it reacts to where each bar closes in its range, not only to the close-to-close change.
How to use it
- Some traders watch zero-line crosses as changes in buying or selling pressure.
- Look for divergence between the oscillator and price.
- Use it with a trend filter to read crosses in context.
- Compare it with MACD to see momentum from volume rather than price.
These are ways some traders read it, for learning. They are not trade signals.
Settings
| Setting | Default |
|---|---|
| Settings | |
| Fast LengthLength of the fast EMA applied to the accumulation/distribution line. | 3 |
| Slow LengthLength of the slow EMA applied to the accumulation/distribution line. | 10 |
| Style | |
| OscillatorColor of the Chaikin Oscillator line. | #787b86 |
| BullishLine and fill color while the oscillator reads above zero (accumulation). | #089981 |
| BearishLine and fill color while the oscillator reads below zero (distribution). | #f23645 |
Alerts
You can alert on its line crossing a value or the candle close (from the chart's + menu); checked while ZoroCharts is open.
Notes and limits
- It needs volume data; on symbols without volume it shows nothing useful.
- It can move against price when closes sit low in rising bars.
Education only. Not financial advice. Indicators mark what happened on the chart; they do not predict what price will do. Trading futures, forex, crypto and other markets carries a high level of risk and may not be suitable for everyone.