
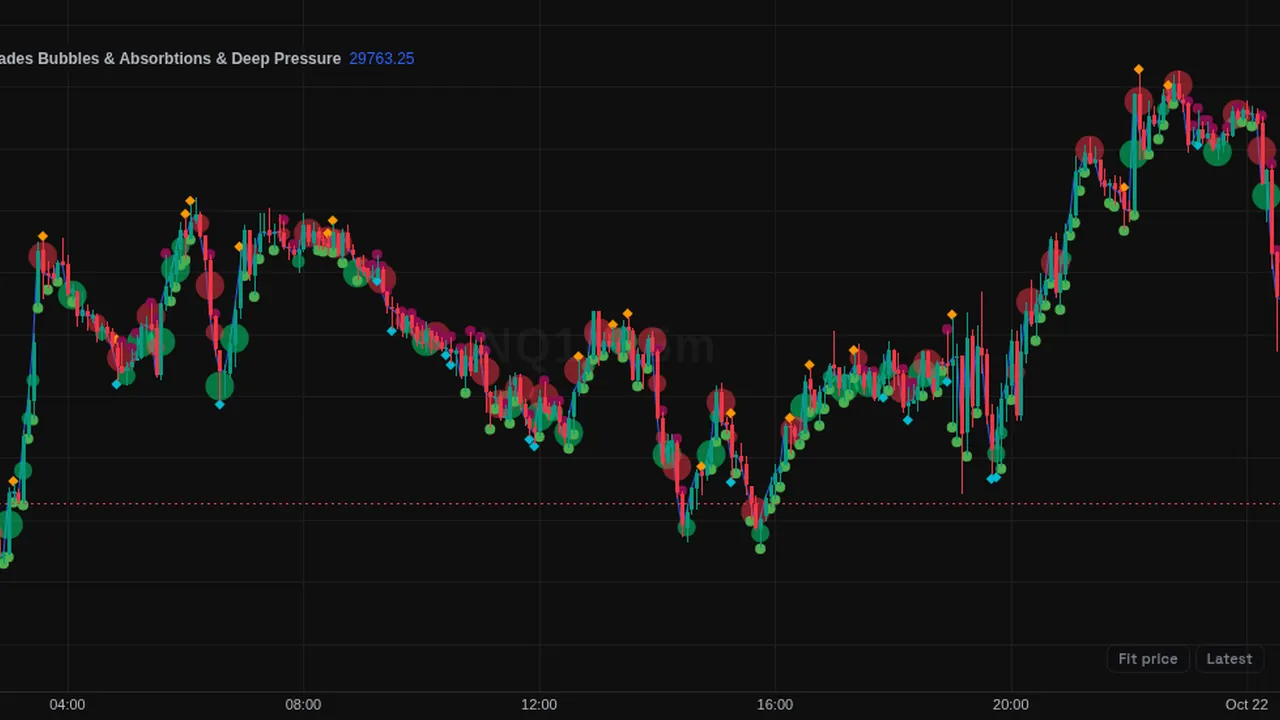
Bubbles on candles with unusual buy or sell pressure in three sizes, plus absorption diamonds and deep-pressure dots.
Overview
This community script highlights candles where estimated buying or selling pressure stands out from recent bars. It draws a circle (bubble) inside or beside the candle: green for buying, red for selling, in small, medium or large size depending on how unusual the bar is.
It also marks absorption bars, where pressure was high but the candle body stayed small, and small dots for deep pressure, when net pressure has stayed on one side for a while.
How it works
The script splits each candle's volume into a buy part and a sell part using where the close sits in the candle range. It then compares each part with its recent average and standard deviation (Lookback 2, threshold 1.5 sigma by default). A bar that clears the threshold, closes in the right part of its range and has a large enough body gets a bubble. Higher scores give bigger bubbles.
Absorption needs the same pressure spike but a small body (at most 0.55 of the range). Deep pressure uses a 10-bar average and a 20-bar EMA of net pressure that both agree in sign.
How to use it
- Use the bubbles to see which candles carried unusually heavy one-sided volume.
- Some traders watch absorption marks near highs or lows as a sign that pressure is being met.
- Use the deep-pressure dots to see which side has been in control over the last few bars.
- Turn on the volume filter to keep only bars above average volume.
These are ways some traders read it, for learning. They are not trade signals.
Settings
| Setting | Default |
|---|---|
| Core | |
| Lookback | 2 |
| Base Sigma Threshold | 1.5 |
| Show Weak Signals | On |
| Visuals | |
| Buy Bubble | color.new(color.lime, 51) |
| Sell Bubble | color.new(color.red, 51) |
| Bubble PositionOptions: Inside Candle, Above/Below Candle | Inside Candle |
| Filters | |
| Min Body/Range Filter | 0.15 |
| Require Volume > Average | Off |
| Absorption | |
Show all 17 settings
| Setting | Default |
|---|---|
| Show Absorption Bars | On |
| Max Body/Range For Absorption | 0.55 |
| Bull Absorption Color | color.new(color.aqua, 0) |
| Bear Absorption Color | color.new(color.orange, 0) |
| Deep Pressure | |
| Show Deep Pressure | On |
| Deep Pressure Length | 10 |
| Pressure EMA Length | 20 |
| Deep Buy Color | color.new(color.green, 0) |
| Deep Sell Color | color.new(color.maroon, 0) |
Alerts
Members can create an alert on its conditions (for example "Big Buy", "Big Sell", "Bull Absorption", "Bear Absorption", "Deep Buy Pressure", "Deep Sell Pressure") from the chart's alert dialog; alerts from indicators run while ZoroCharts is open in the browser.
Notes and limits
- Buy and sell pressure is estimated from candle shape and volume, not from actual trade-by-trade data.
- It needs volume data and works on any market and timeframe that has it.
Education only. Not financial advice. Indicators mark what happened on the chart; they do not predict what price will do. Trading futures, forex, crypto and other markets carries a high level of risk and may not be suitable for everyone.