
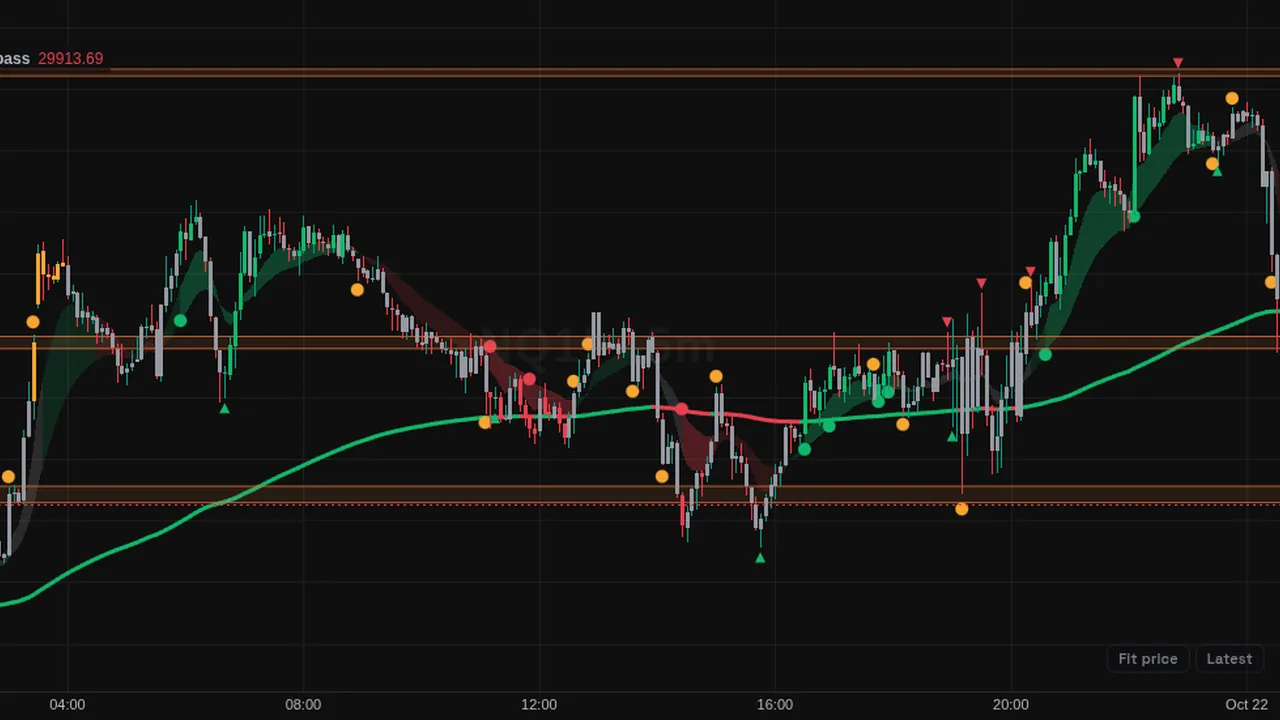
Structure bias with range filter, 8/21 trend ribbon, 200 EMA, context dots, support and resistance zones and a status panel.
Overview
This community script reads market structure and shows a simple state: follow the trend, wait, or stay out of the chop. It draws a fast and slow trend ribbon (8 and 21 by default), a 200 EMA, colored momentum candles and small context dots.
It also marks structure levels with labels, SBS triangles at liquidity rejections, up to three dynamic support and resistance zones, and a status panel with the current phase. An optional table shows the state on four other timeframes.
How it works
Structure uses two causal swing lengths: a primary (outer) swing of 2 and a local swing of 1. A break is accepted after one close beyond the level. A pullback counts as orderly if it retraces no more than 0.618 of the leg; two local breaks against the primary trend put it on turn watch.
A range is declared after four local flips within 30 bars when the range is no wider than 3.5 ATR; two closes outside end it. Exhaustion dots use RSI(14) above 75 or below 25 and a stretch of 2 ATR from the ribbon. Support and resistance zones come from pivots of strength 15.
How to use it
- Use the status panel to see whether structure is aligned, pulling back or turning.
- Some traders stand aside while the range filter is active.
- Watch the exhaustion dots when price is stretched far from the ribbon.
- Use the multi-timeframe table to compare the state across timeframes.
These are ways some traders read it, for learning. They are not trade signals.
Settings
| Setting | Default |
|---|---|
| Market Structure | |
| Primary Swing Length | 2 |
| Local Swing Length | 1 |
| Accepted Break Closes | 1 |
| Orderly Pullback Max Depth | 0.618 |
| Turn Watch Counter Breaks | 2 |
| Use Standard OHLC on Heikin Ashi Charts | On |
| Range Filter | |
| Range Lookback | 30 |
| Local Flips to Establish Range | 4 |
| Max Range Width (ATR) | 3.5 |
| Closes Outside to Exit Range | 2 |
Show all 53 settings
| Setting | Default |
|---|---|
| Trend Ribbon & 200 EMA | |
| Show Trend Ribbon | On |
| Ribbon Fast | 8 |
| Slow | 21 |
| Show 200 EMA | On |
| EMA Length | 200 |
| EMA Width | 3 |
| Context Dots & Momentum Candles | |
| Show Context Dots | On |
| Momentum Candles | On |
| Exhaustion RSI Length | 14 |
| Exhaustion RSI Upper | 75.0 |
| Exhaustion RSI Lower | 25.0 |
| Exhaustion Stretch (ATR from Ribbon) | 2.0 |
| Structure Levels | |
| Show Structure Fail (Grey Trailing Line) | Off |
| Show Next Test (Dashed Orange Line) | Off |
| Show Level Labels | On |
| SBS Triangles | |
| Show SBS Triangles | On |
| Liquidity Swing Length | 5 |
| Max Remembered Levels | 10 |
| Max Level Age (Bars) | 300 |
| Min Rejection Wick (% of Range) | 0.3 |
| Dynamic Support/Resistance | |
| Show Dynamic Support/Resistance | On |
| Pivot Strength | 15 |
| Max Zones | 3 |
| Zone Height (ATR) | 0.25 |
| Merge Distance (ATR) | 0.5 |
| Status Panel | |
| Show Status Panel | On |
| PositionOptions: Top Right, Top Left, Top Center, Middle Right, Bottom Right, Bottom Left | Top Right |
| Text SizeOptions: Tiny, Small, Normal | Small |
| Multi-Timeframe Alignment | |
| Show Multi-Timeframe Table | Off |
| PositionOptions: Top Right, Top Left, Top Center, Middle Right, Bottom Right, Bottom Left | Bottom Right |
| Timeframe 1 | 5 |
| Timeframe 2 | 15 |
| Timeframe 3 | 60 |
| Timeframe 4 | 240 |
| Chart Captions | |
| Show Chart Captions (Follow the Trend / Stay Out of the Chop) | Off |
| Colors | |
| Bullish | #12B76A |
| Bearish | #E5404F |
| Wait / Caution | #F7A531 |
| Neutral | #9598A1 |
| Support/Resistance | #E2703A |
| Next Test | #F7931A |
| Structure Fail | #8C8C8C |
| Panel Background | #131722 |
Alerts
Members can create an alert on its conditions (for example "Stoic Edge Compass - Green", "Stoic Edge Compass - Red", "Stoic Edge Compass - Range Established", "Stoic Edge Compass - SBS Bullish") from the chart's alert dialog; alerts from indicators run while ZoroCharts is open in the browser.
Notes and limits
- On Heikin Ashi charts it can use standard OHLC for its logic.
- The multi-timeframe table needs extra data requests and is off by default.
Education only. Not financial advice. Indicators mark what happened on the chart; they do not predict what price will do. Trading futures, forex, crypto and other markets carries a high level of risk and may not be suitable for everyone.