
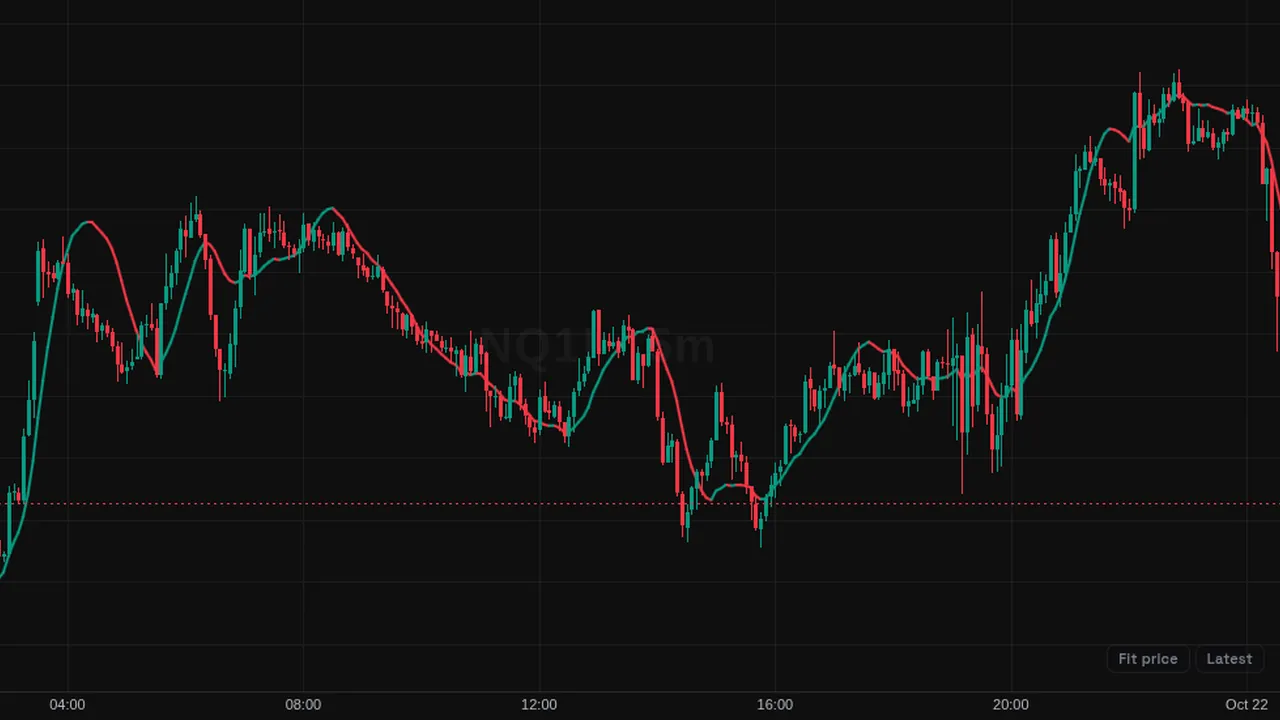
Least squares moving average: the end point of a straight-line fit over the last 25 bars, colored by its slope.
Overview
The Least Squares Moving Average (LSMA) fits a straight line through the last 25 closes on every bar and plots where that line ends. The result tracks price more closely than a simple average of the same length.
With Slope Trend Coloring on, the line turns green while rising, red while falling and gray when flat.
How it works
On each bar the indicator runs a linear regression on the last N values (25 by default) and plots the fitted value at the current bar. Regression Offset steps back along the fitted line: 0 uses the end point, larger values read the line further back for a smoother result.
Because it follows the fitted trend, it can lead turns that a same-length SMA trails, but it can overshoot after sharp moves.
How to use it
- Use the color change to see when the fitted trend flips direction.
- Some traders compare price with the LSMA to see how far it has stretched from its recent trend.
- Use it as a faster alternative to an SMA of the same length.
- Watch a flat gray line as a sign of a pause in trend.
These are ways some traders read it, for learning. They are not trade signals.
Settings
| Setting | Default |
|---|---|
| Settings | |
| SourcePrice series the regression line is fitted to.Options: Close, Open, High, Low, HL2, HLC3, OHLC4, HLCC4 | Close |
| LSMA LengthNumber of bars N in each least-squares fit. Every bar fits a straight line to its last N values and plots where that line ends, so the average leads turns that a same-length SMA trails, at the cost of overshooting after sharp moves. | 25 |
| Regression OffsetBars to step back along each bar's fitted line. 0 plots the line's endpoint at the current bar; larger values read the fit further back, trading lead for smoothness. | 0 |
| Style | |
| Slope Trend ColoringColors the line by its slope — bullish while it rises, bearish while it falls. Disable to draw it in the neutral color. | On |
| Bullish | #089981 |
| Bearish | #f23645 |
| Neutral | #787b86 |
| Line WidthWidth of the plotted line, in pixels. | 2 |
Alerts
You can alert on its line crossing a value or the candle close (from the chart's + menu); checked while ZoroCharts is open.
Notes and limits
- Works on any symbol and timeframe; it only needs candle data.
- It can overshoot after sudden moves because it projects the recent slope.
Education only. Not financial advice. Indicators mark what happened on the chart; they do not predict what price will do. Trading futures, forex, crypto and other markets carries a high level of risk and may not be suitable for everyone.