
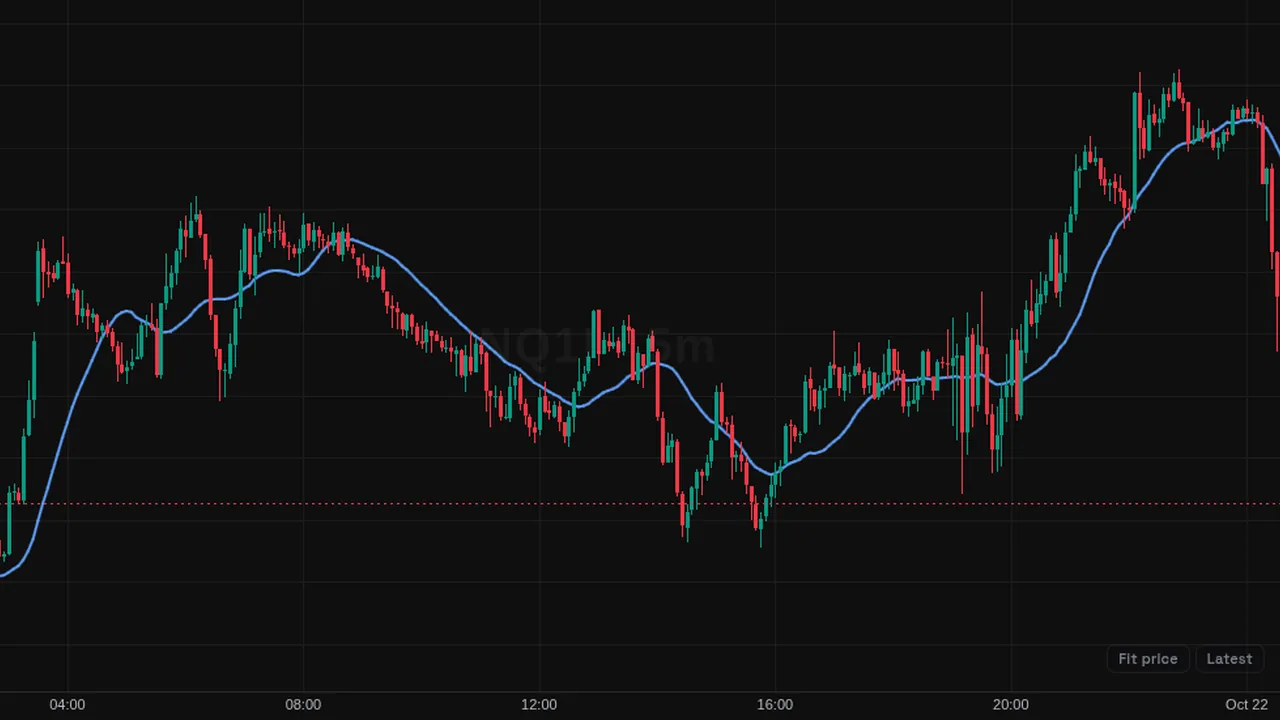
A single simple moving average line on the price chart: the plain average of the last 20 closes by default.
Overview
The Simple Moving Average (SMA) draws one line that is the plain average of the last N values. By default it averages 20 closing prices and is drawn in blue.
You can change the source, shift the line with an offset, and pick its color.
How it works
SMA = sum of the last N values / N. Each bar in the window counts the same, and the oldest bar drops out when a new one arrives.
Because every bar weighs the same, the SMA is smoother but slower to react than an EMA of the same length.
How to use it
- Some traders watch whether price closes above or below the line.
- Use its slope to read the direction of the trend.
- Add a second SMA of another length and watch where they cross.
- Some traders use well-known lengths like 50 or 200 as broad trend references.
These are ways some traders read it, for learning. They are not trade signals.
Settings
| Setting | Default |
|---|---|
| Settings | |
| LengthNumber of bars used in the SMA calculation. | 20 |
| SourcePrice series the SMA is calculated on.Options: Close, Open, High, Low, HL2, HLC3, OHLC4, HLCC4 | Close |
| OffsetBars the plotted line is displaced by. Positive values push it to the right. | 0 |
| Style | |
| Color | #5b9cf6 |
Alerts
You can alert on its line crossing a value or the candle close (from the chart's + menu); checked while ZoroCharts is open.
Notes and limits
- Works on any symbol and timeframe; it only needs candle data.
- The line can jump when a large bar drops out of the window.
Education only. Not financial advice. Indicators mark what happened on the chart; they do not predict what price will do. Trading futures, forex, crypto and other markets carries a high level of risk and may not be suitable for everyone.