
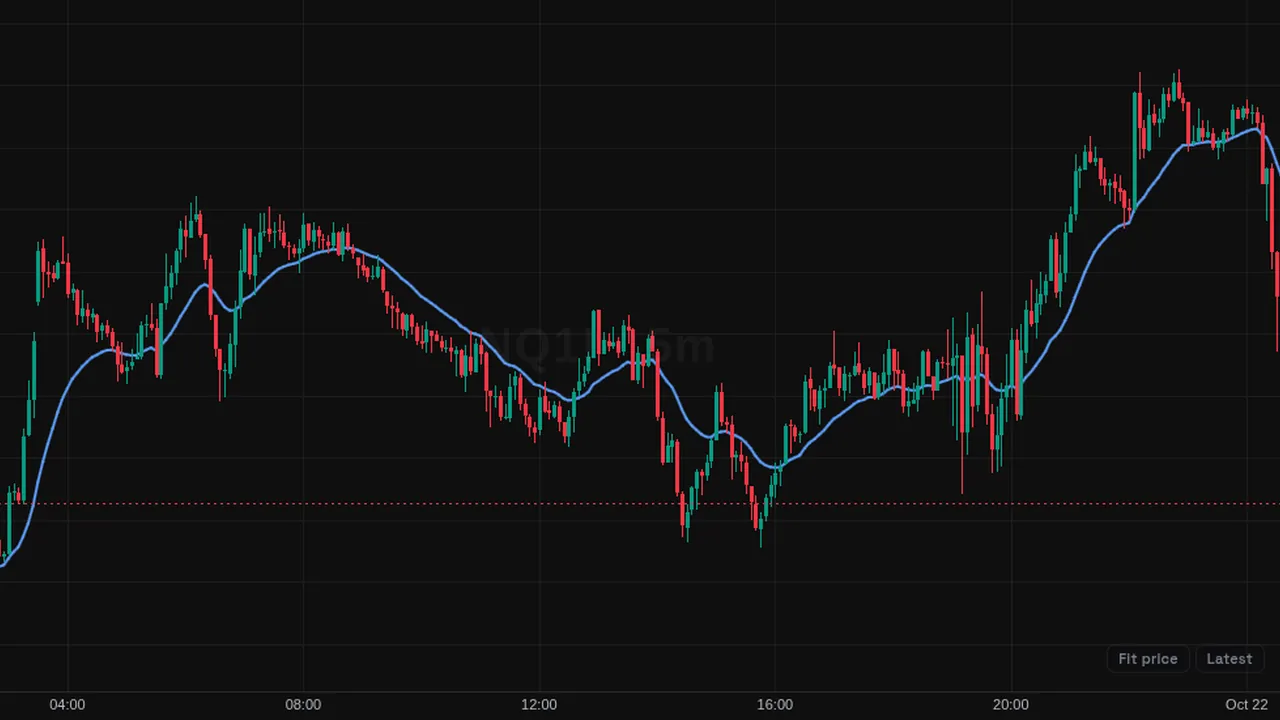
A single exponential moving average line on the price chart, 20 bars on the close by default, weighted toward recent bars.
Overview
The Exponential Moving Average (EMA) draws one smooth line over price. It reacts faster than a simple average of the same length because recent bars carry more weight.
By default it uses 20 bars of closing prices and is drawn in blue. You can change the source, shift the line with an offset, and pick its color.
How it works
Each new value is the previous EMA plus a share of the gap between the latest price and that EMA. The share is 2 / (Length + 1), so with a length of 20 each bar moves the line about 9.5% of the way toward price.
Older bars never drop out completely; their influence fades smoothly over time.
How to use it
- Some traders watch whether price is above or below the line to judge the short-term trend.
- Use its slope to see if momentum is building or fading.
- Pair two EMAs of different lengths and watch where they cross.
- Some traders treat the line as a moving area of support or resistance in a trend.
These are ways some traders read it, for learning. They are not trade signals.
Settings
| Setting | Default |
|---|---|
| Settings | |
| LengthNumber of bars used in the EMA calculation. | 20 |
| SourcePrice series the EMA is calculated on.Options: Close, Open, High, Low, HL2, HLC3, OHLC4, HLCC4 | Close |
| OffsetBars the plotted line is displaced by. Positive values push it to the right. | 0 |
| Style | |
| Color | #5b9cf6 |
Alerts
You can alert on its line crossing a value or the candle close (from the chart's + menu); checked while ZoroCharts is open.
Notes and limits
- Works on any symbol and timeframe; it only needs candle data.
- Like any average it lags price, so turns show up after they start.
Education only. Not financial advice. Indicators mark what happened on the chart; they do not predict what price will do. Trading futures, forex, crypto and other markets carries a high level of risk and may not be suitable for everyone.