
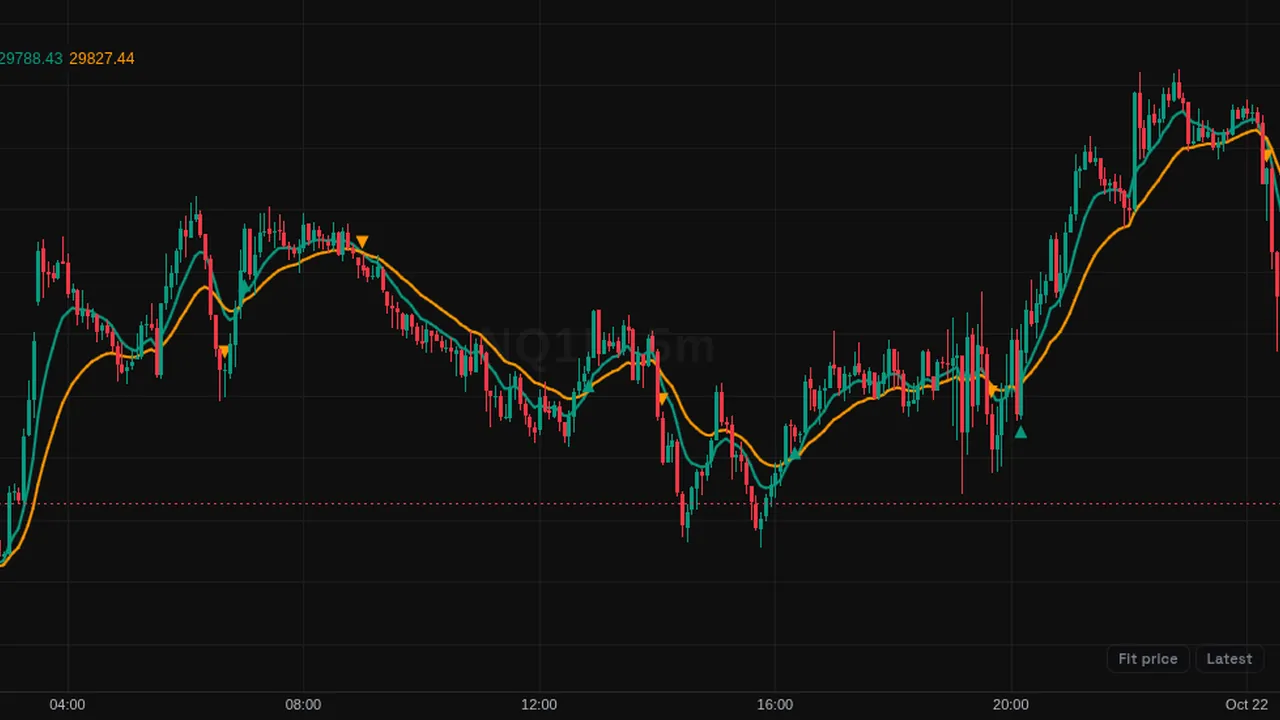
Plots a fast 9-period and slow 21-period EMA on the chart and marks each point where the fast line crosses the slow one.
Overview
EMA 9/21 cross is a short example Pine script. It draws two exponential moving averages on the price chart: a fast EMA in teal and a slow EMA in orange. A small teal triangle below the bar marks a cross up, and an orange triangle above the bar marks a cross down.
How it works
Both lines are standard exponential moving averages of the close, with lengths 9 and 21 by default. A cross up is the bar where the fast EMA moves above the slow EMA; a cross down is the bar where it moves below. You can change both lengths.
How to use it
- Some traders use the cross as a simple way to see a change in short-term direction.
- Use the gap between the two lines to see how strong the trend is.
- Some traders watch for price pulling back to the slow EMA during a trend.
- Use it as a starting point to learn how Pine scripts plot lines and markers.
These are ways some traders read it, for learning. They are not trade signals.
Settings
| Setting | Default |
|---|---|
| Fast EMA | 9 |
| Slow EMA | 21 |
Notes and limits
- Moving averages lag price, so crosses appear after the move has started.
- In sideways markets the lines can cross back and forth often.
- The script has no alert conditions.
Education only. Not financial advice. Indicators mark what happened on the chart; they do not predict what price will do. Trading futures, forex, crypto and other markets carries a high level of risk and may not be suitable for everyone.