
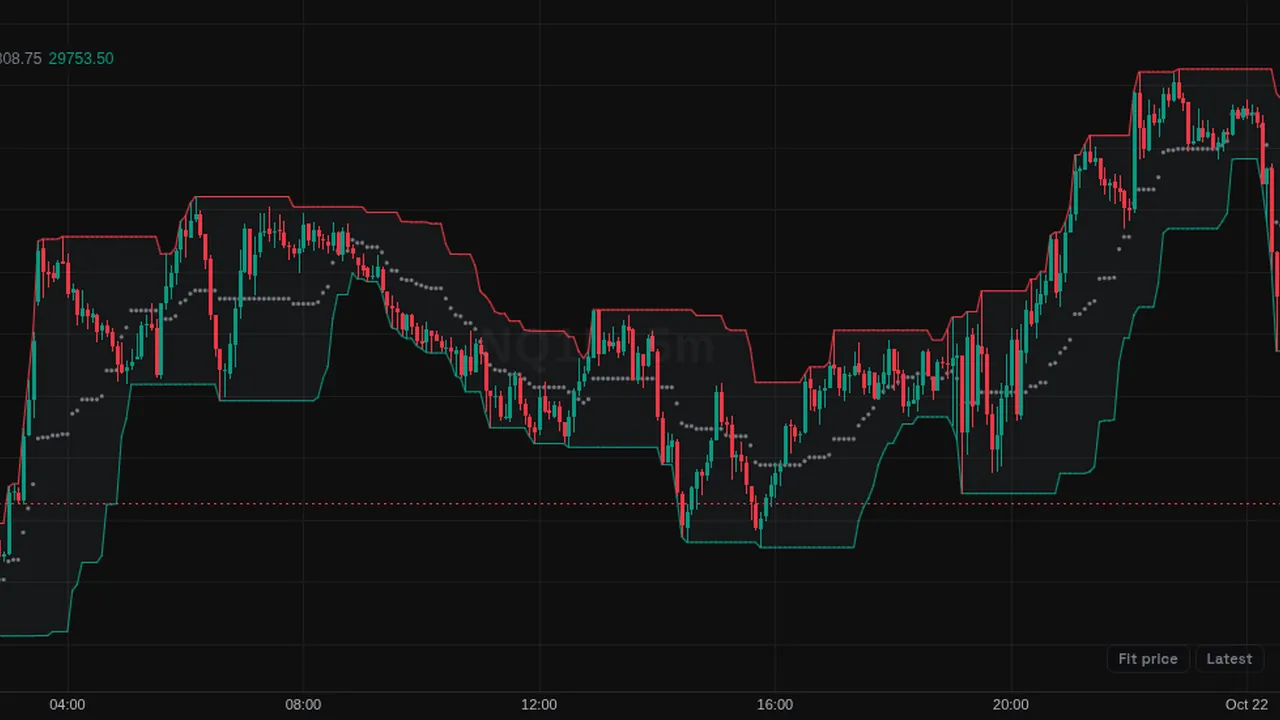
Donchian Channels: the highest high and lowest low of the last 20 bars, with a middle line between them.
Overview
Donchian Channels draw the upper and lower edge of the recent range on the price chart, with a middle line and light fill.
The upper line is red, the lower line green and the middle gray by default.
How it works
Upper = highest high of 20 bars. Lower = lowest low of 20 bars. Middle = (upper + lower) / 2.
Only the length can be changed. The lines are flat until a new high or low enters the window or an old one drops out.
How to use it
- Some traders watch a close above the upper line or below the lower line as a range breakout.
- Use the middle line to see which half of the range price is in.
- Use the lower line as a trailing level in an uptrend.
- Watch a narrowing channel as a sign of a tight range.
These are ways some traders read it, for learning. They are not trade signals.
Settings
| Setting | Default |
|---|---|
| Settings | |
| LengthLookback length. The upper and lower channels are the highest high and lowest low over this many bars. | 20 |
| Style | |
| UpperColor of the upper channel line. | #f23645 |
| MiddleColor of the channel midline. | #787b86 |
| LowerColor of the lower channel line. | #089981 |
| FillColor of the channel interior fill. | #787b8614 |
Alerts
You can alert on its line crossing a value or the candle close (from the chart's + menu); checked while ZoroCharts is open.
Notes and limits
- Works on any symbol and timeframe; it only needs candle data.
- The channel only steps when a new extreme is made or an old one leaves the window.
Education only. Not financial advice. Indicators mark what happened on the chart; they do not predict what price will do. Trading futures, forex, crypto and other markets carries a high level of risk and may not be suitable for everyone.