
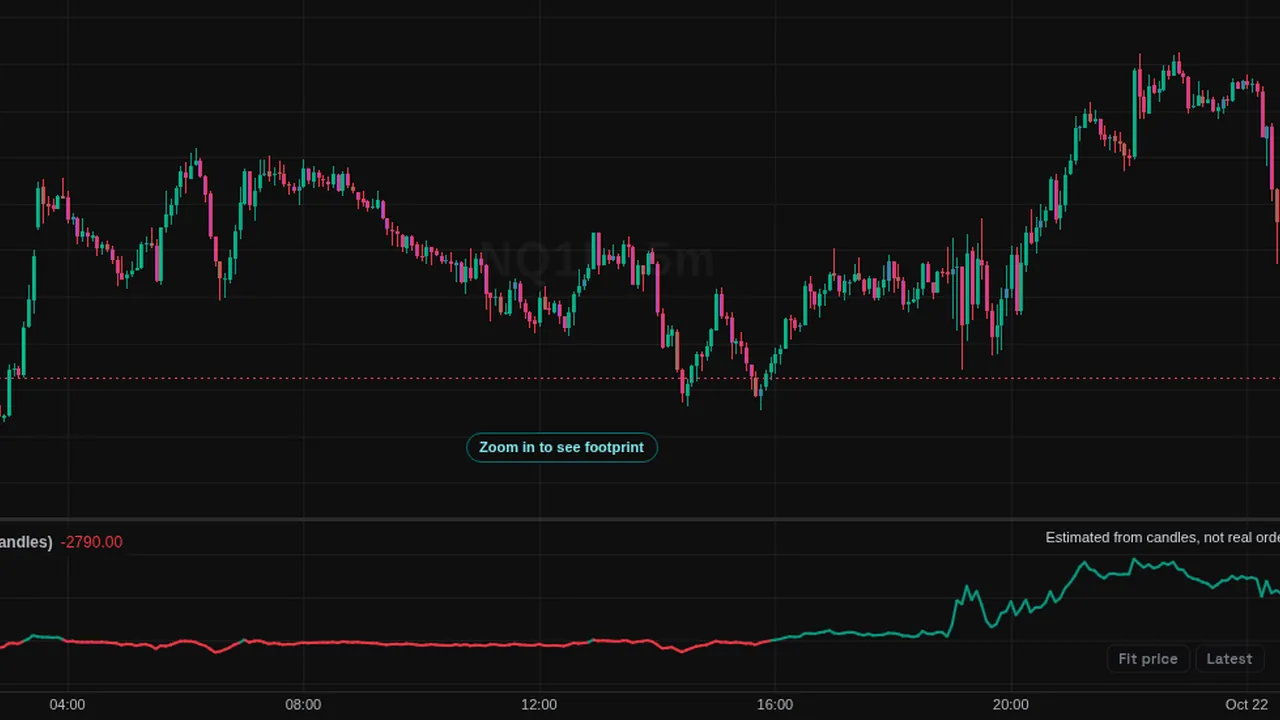
Estimates buying and selling from where each candle closed in its range, and plots it as a cumulative line or per-bar delta.
Overview
Estimated CVD (from candles) gives a rough delta for charts with no trade data. It draws a cumulative line in its own pane by default, or per-bar estimated delta as a histogram. A note on the chart says it is estimated from candles, not real order flow.
How it works
Each candle's volume is split by where it closed in its range. A candle closing at its high counts as all buying, at its low as all selling, and in the middle as even. The formula is volume times (close minus low, minus high minus close), divided by the range.
The cumulative line resets each session by default, or never.
How to use it
- Some traders use it as a rough guide to buying and selling pressure on any symbol.
- Use it to compare the direction of the line with price.
- Some traders use it where real trade data is not available.
These are ways some traders read it, for learning. They are not trade signals.
Settings
| Setting | Default |
|---|---|
| ShowOptions: cvd, delta | cvd |
| Reset CVDOptions: session, none | session |
| Buying colour | #089981 |
| Selling colour | #f23645 |
Notes and limits
- It is a guess from candles; it does not see individual trades.
- For real order flow, see Cumulative Delta (trades) on crypto or Cumulative Delta (L2) on futures.
Education only. Not financial advice. Indicators mark what happened on the chart; they do not predict what price will do. Trading futures, forex, crypto and other markets carries a high level of risk and may not be suitable for everyone.