
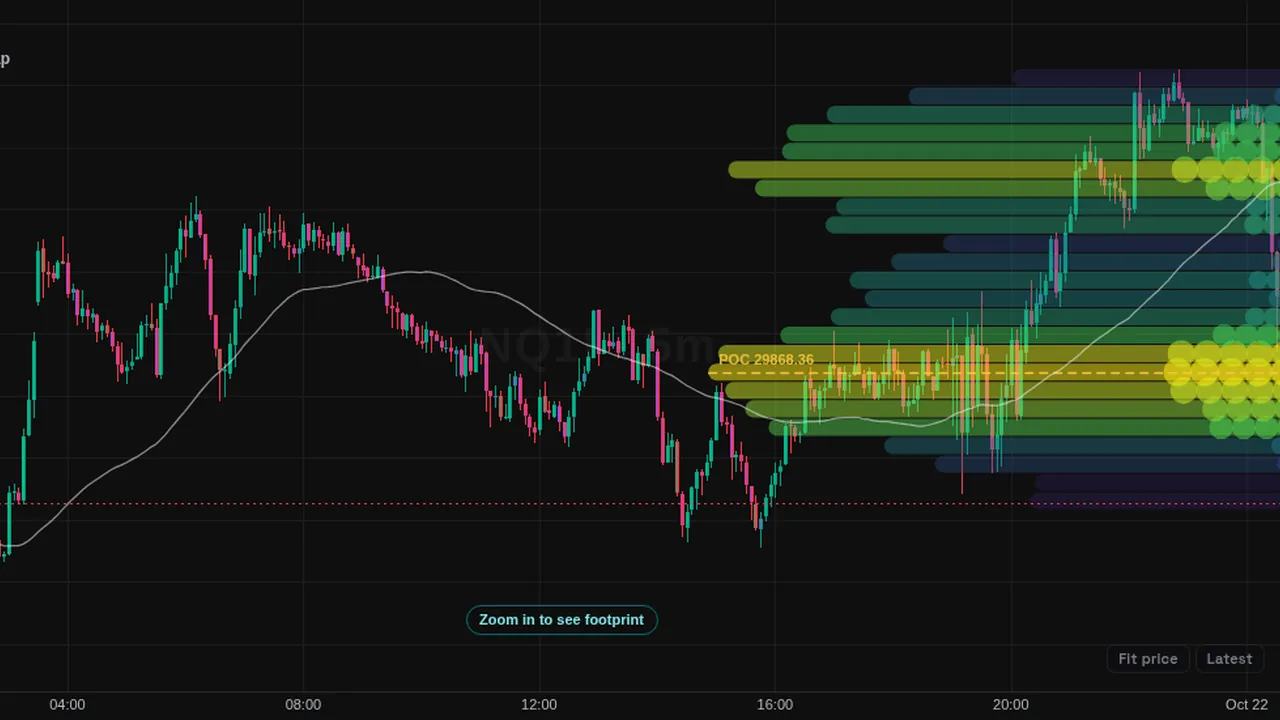
Paints heat zones from volume at price over the last 180 bars, with the point of control and a moving-average trend baseline.
Overview
Liquidity Trend Heatmap shows where volume built up over recent bars as horizontal heat zones extending across the right part of the chart. Zones can be drawn as blocks, nodes or both. The point of control is drawn in gold, and a trend baseline follows price.
How it works
The last 180 bars are split into 26 price levels. Each bar's volume is spread over the levels between its low and high and added with the candle's direction. Only levels above 8% of the POC's volume are drawn, with opacity up to 48%.
The trend baseline is a simple moving average of the close over 55 bars. Everything is built from the chart's own candle volume.
How to use it
- Some traders use it to see the main high-volume area of the recent range.
- Use the POC as a reference for where most recent volume traded.
- Some traders read the baseline to see whether price is above or below its recent average.
These are ways some traders read it, for learning. They are not trade signals.
Settings
| Setting | Default |
|---|---|
| Lookback bars | 180 |
| Price levels | 26 |
| Show above (% of POC volume) | 8 |
| Max opacity % | 48 |
| Zone extension % of chart | 42 |
| Node size | 18 |
| Show POC | On |
| Show trend baseline | On |
| Trend length | 55 |
| Heat styleOptions: blocks + nodes, blocks only, nodes only | blocks + nodes |
| POC colour | #f5c542 |
| Trend colour | #eeeeee |
Notes and limits
- Needs bars with volume.
- Built from candles, not from the order book, despite the name.
Education only. Not financial advice. Indicators mark what happened on the chart; they do not predict what price will do. Trading futures, forex, crypto and other markets carries a high level of risk and may not be suitable for everyone.