
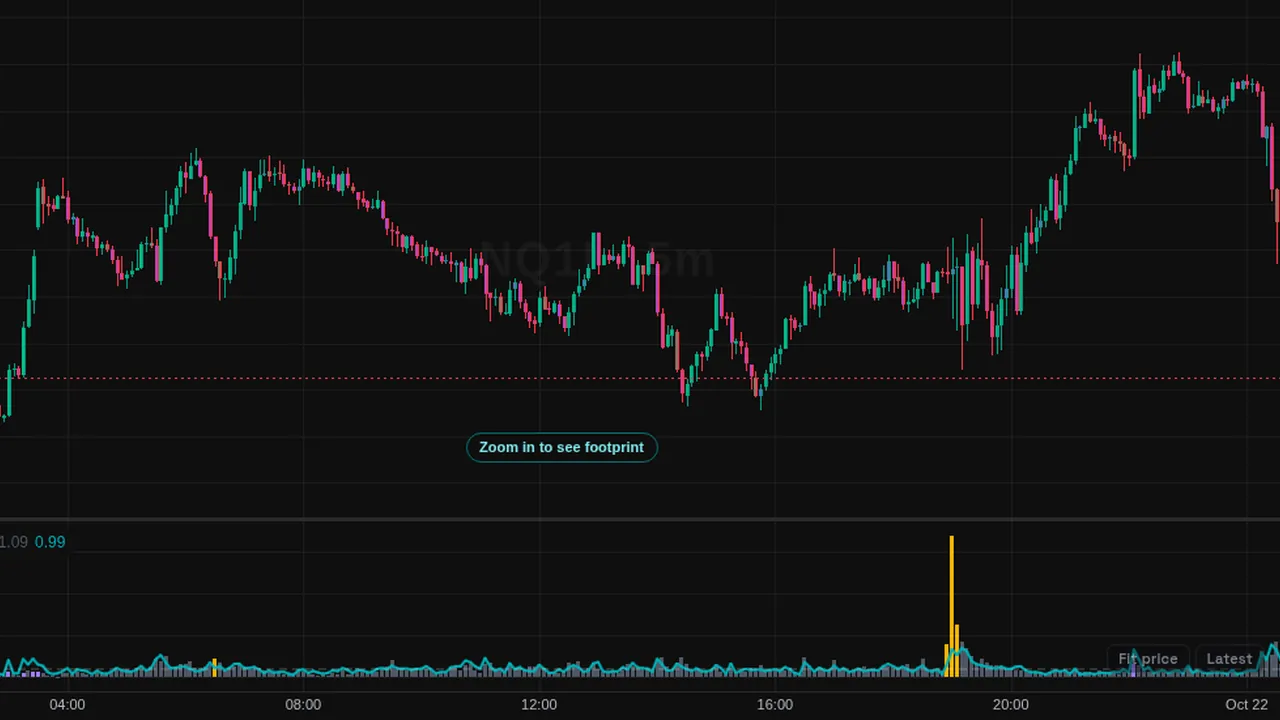
A lower pane comparing each bar's volume with its range, flagging high-effort, low-result bars and the reverse.
In plain English
What it shows
- A lower pane that compares each bar's volume (effort) with its range (result). High effort with low result is flagged amber; low effort with high result is flagged violet.
How traders use it
- Look for bars where a lot traded but price went nowhere, or the reverse.
- Use the flags to review those bars on the chart.
What it does not tell you
- Bars are compared with their own recent average, so the same volume can flag differently on different days.
- A flag is a description of a bar, not a signal.
Overview
Effort vs Result compares how much traded with how far price moved. Effort is the bar's volume against its average; result is the bar's range against its average. Both are drawn in their own pane.
Bars with high effort and low result are flagged in amber. Bars with low effort and high result are flagged in violet.
How it works
Averages run over 20 bars. A bar is flagged as high effort, low result when its effort is at least 1.5 times average and its effort-to-result ratio is at least 2. The reverse flag marks bars that moved far on little volume; it can be turned off.
It uses traded volume where order flow exists and the chart's own volume elsewhere.
How to use it
- Some traders read high effort with little movement as one side meeting the other.
- Use the low effort flags to see moves that came on thin volume.
- Some traders compare the flags with nearby support or resistance.
These are ways some traders read it, for learning. They are not trade signals.
Settings
| Setting | Default |
|---|---|
| Average over (bars) | 20 |
| Flag when effort at least (x average) | 1.5 |
| and effort / result at least | 2 |
| Also flag low effort / high result | On |
| Effort (volume) | #5b6474 |
| Result (range) | #00adb5 |
| High effort, low result | #f5b301 |
| Low effort, high result | #9b7bff |
Notes and limits
- Needs bars with volume.
- It compares bars with their own recent average, so the same volume can flag differently on different days.
Education only. Not financial advice. Indicators mark what happened on the chart; they do not predict what price will do. Trading futures, forex, crypto and other markets carries a high level of risk and may not be suitable for everyone.