
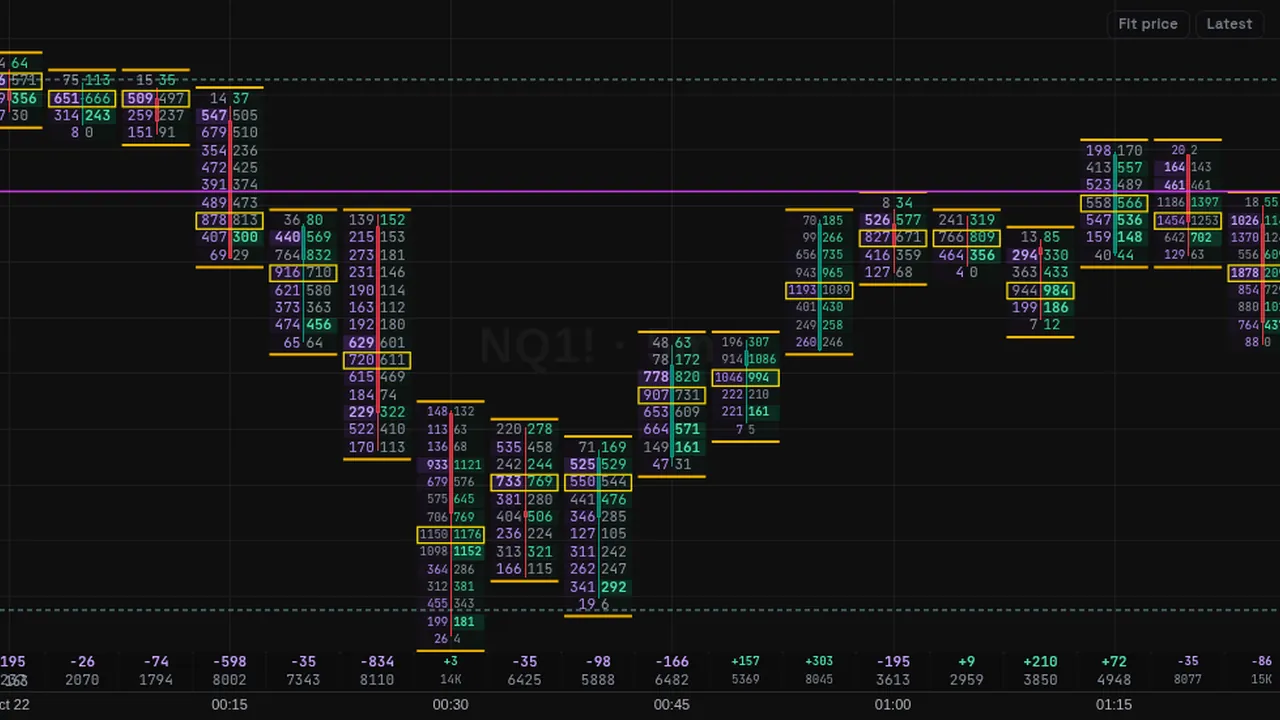
Builds a TPO market profile per session, drawn as letters or blocks per 30 minutes, with initial balance, POC, value area and single prints.
In plain English
What it shows
- How much time price spent at each level in a session, built from 30-minute letters (TPO means time price opportunity). It marks the initial balance, the point of control (POC, the busiest price), the 70% value area and single prints.
How traders use it
- See where the session found acceptance and where it moved quickly.
- Compare today's profile with previous days.
What it does not tell you
- It is built from candles, so it shows time at price, not volume.
- A profile describes a session that has happened, not the next one.
Overview
Market Profile (TPO) shows how much time price spent at each level during a session. Each 30-minute period gets its own letter, and each price row shows which periods traded there. When letters do not fit, they are drawn as blocks.
The profile marks the initial balance (the first 2 periods) as a bar at the left edge, the POC in magenta, the 70% value area in grey with teal outside it, VAH and VAL lines, and single prints. A footer shows the period count and the initial balance range.
How it works
Market Profile uses only the chart's candles: time at price, not volume. By default the session is RTH (09:30 to 16:00 New York) on futures and the UTC day on crypto; full uses the futures trading day from 18:00 New York.
Row size is automatic by default. The POC is the row with the most periods, and the value area grows from it until it holds 70% of the time spent.
How to use it
- Some traders watch whether price stays inside or breaks out of the initial balance.
- Use single prints to see fast moves where price spent little time.
- Some traders compare the TPO POC with a volume POC.
- Use the value area to see where the session spent most of its time.
These are ways some traders read it, for learning. They are not trade signals.
Settings
| Setting | Default |
|---|---|
| Sessionauto = RTH 09:30-16:00 New York for futures, the UTC day for crypto. full = the futures trading day (18:00 New York).Options: auto, rth, full | auto |
| Period (minutes per letter) | 30 |
| Show asauto = letters when they fit, else blocks.Options: auto, letters, blocks | auto |
| Row size (ticks, 0 = auto) | 0 |
| Value area % | 70 |
| Initial balance (periods) | 2 |
| Width % of the session | 70 |
| Value area | #9aa3ad |
| Outside value area | #3f8f9a |
| POC | #e040fb |
| VAH / VAL lines | #8fd8dc |
Notes and limits
- Works from candles, so it works on any symbol with intraday bars.
- Profile width defaults to 70% of the session; very long sessions may need zooming.
Education only. Not financial advice. Indicators mark what happened on the chart; they do not predict what price will do. Trading futures, forex, crypto and other markets carries a high level of risk and may not be suitable for everyone.