
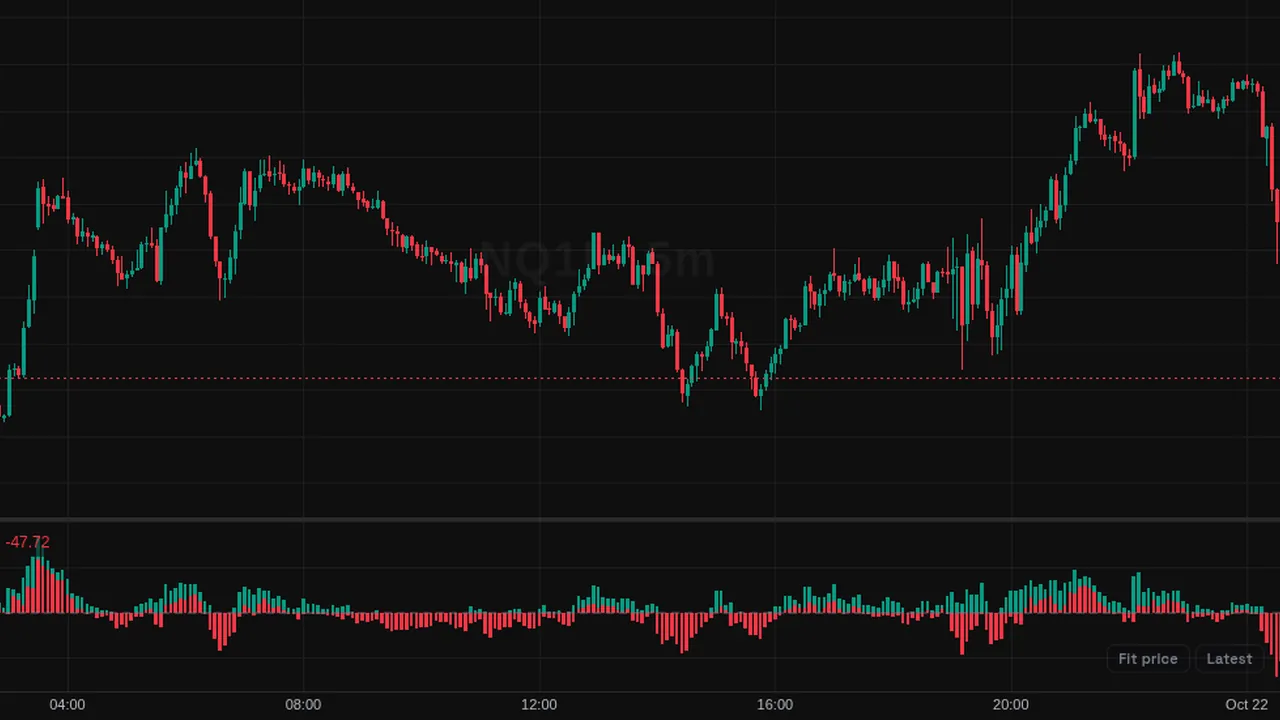
Elder Ray: Bull Power (high minus 13 EMA) and Bear Power (low minus 13 EMA) as two histograms.
Overview
Elder Ray, by Alexander Elder, shows the strength of buyers and sellers in its own pane. Bull Power is drawn in green and Bear Power in red, both around zero.
It compares each bar's high and low with a 13-bar exponential moving average of closes.
How it works
Bull Power = high - EMA(close, 13). Bear Power = low - EMA(close, 13).
Bull Power above zero means the bar's high cleared the average; Bear Power below zero means its low went under it.
How to use it
- Some traders use the EMA slope for the trend and Bear Power for dips in an uptrend.
- Watch Bull Power shrinking while price makes new highs as a sign of weaker buying.
- Watch Bear Power rising toward zero in a downtrend as easing selling.
- Use both bars together to see the range of each candle around the average.
These are ways some traders read it, for learning. They are not trade signals.
Settings
| Setting | Default |
|---|---|
| Settings | |
| EMA LengthNumber of bars in the exponential moving average of closing prices used as the reference level for Bull Power and Bear Power. Alexander Elder's classic setting is 13. | 13 |
| Style | |
| Bull PowerColor of the Bull Power columns. | #089981 |
| Bear PowerColor of the Bear Power columns. | #f23645 |
Alerts
You can alert on its line crossing a value or the candle close (from the chart's + menu); checked while ZoroCharts is open.
Notes and limits
- Works on any symbol and timeframe; it only needs candle data.
- It is usually read together with the trend of the EMA itself.
Education only. Not financial advice. Indicators mark what happened on the chart; they do not predict what price will do. Trading futures, forex, crypto and other markets carries a high level of risk and may not be suitable for everyone.